标签:
Graphite 是一个Python写的web应用,采用django框架,Graphite用来进行收集服务器所有的即时状态,用户请求信息,Memcached命中率,RabbitMQ消息服务器的状态,Unix操作系统的负载状态,Graphite服务器大约每分钟需要有4800次更新操作,Graphite采用简单的文本协议和绘图功能可以方便地使用在任何操作系统上。
官方文档:https://graphite.readthedocs.org/en/latest/overview.html
Graphite does two things:
What Graphite does not do is collect data for you, however there are some tools out there that know how to send data to graphite. Even though it often requires a little code, sending data to Graphite is very simple.
Graphite is an enterprise-scale monitoring tool that runs well on cheap hardware. It was originally designed and written by Chris Davis at Orbitz in 2006 as side project that ultimately grew to be a foundational monitoring tool. In 2008, Orbitz allowed Graphite to be released under the open source Apache 2.0 license. Since then Chris has continued to work on Graphite and has deployed it at other companies including Sears, where it serves as a pillar of the e-commerce monitoring system. Today many large companies use it.
Graphite consists of 3 software components:
Feeding in your data is pretty easy, typically most of the effort is in collecting the data to begin with. As you send datapoints to Carbon, they become immediately available for graphing in the webapp. The webapp offers several ways to create and display graphs including a simple URL API for rendering that makes it easy to embed graphs in other webpages.
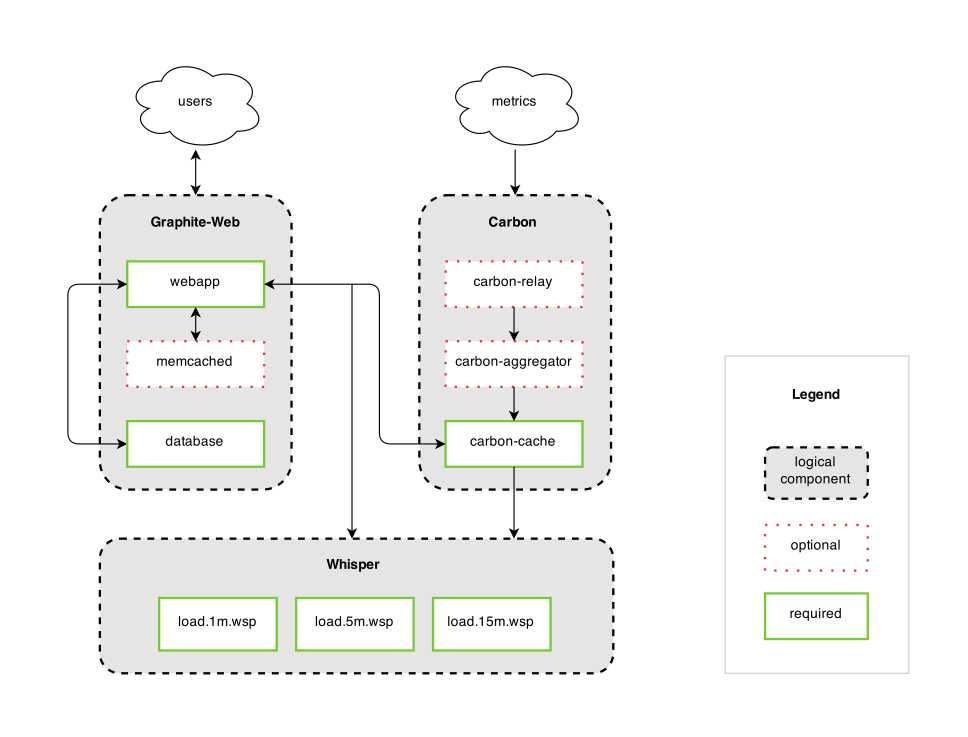
架构图:

在这个图中我们可以看到Carbon先将数据写入到Whisper数据库文件中,然后Graphite Webapp去读取这个数据,然后显示出图形。但是实际上这个体系采用了缓存,数据可能先到缓存中,然后Webapp读取,显示出图形。这也是为什么在主机I/O反应不过来时Webapp的图形仍能以接近实时的方式显示。
http://blog.csdn.net/crazyhacking/article/details/8363235
http://www.infoq.com/cn/articles/graphite-intro?utm_campaign=infoq_content&utm_source=infoq&utm_medium=feed&utm_term=global
http://segmentfault.com/a/1190000000744706
标签:
原文地址:http://www.cnblogs.com/youxin/p/4768764.html