标签:
做项目要统计商品的销售情况,美工那边给了效果图,自己就按照效果图自定义了一个ScrollView。整体效果不错,在做的过程中遇到的问题也记录一下。
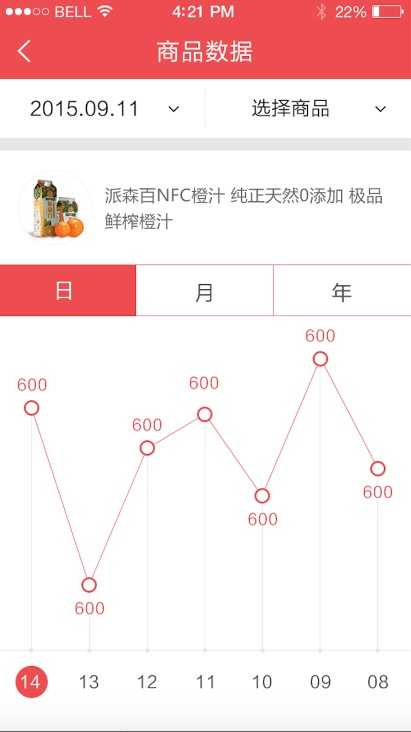
现在这个还有许多优化的地方:
1.一个表中只能画一个折线
2.目前的要求最小值为0,没考虑负数的最小值
//
//  LineChartView.h
//  chart
//
//  Created by City--Online on 15/9/17.
//  Copyright © 2015年 City--Online. All rights reserved.
//

#import <UIKit/UIKit.h>

//设置两点的水平间距
#define SPACING 70.0

//文本类型
typedef NS_ENUM(NSInteger, TitleType) {
    TitleForX,
    TitleForPoint
};


@class LineChartView;

@protocol LineChartDataSource <NSObject>
@required

//折点数量
-(NSInteger)numberForChart:(LineChartView *)chart;

//折点数值
-(float)chart:(LineChartView *)chart valueAtIndex:(NSInteger)index;

@optional

//X轴坐标是否有背景色
-(BOOL)chart:(LineChartView *)chart backGroundColorAtXPointIndex:(NSInteger)index;

//X 轴的标题
-(NSString *)chart:(LineChartView *)chart titleForXLabelAtIndex:(NSInteger)index;

@end

@interface LineChartView : UIScrollView
@property(nonatomic,assign)id<LineChartDataSource> dataSource;
@end
//
//  LineChartView.m
//  chart
//
//  Created by City--Online on 15/9/17.
//  Copyright © 2015年 City--Online. All rights reserved.
//

#import "LineChartView.h"

@interface LineChartView ()
@property (nonatomic,strong) CAShapeLayer * linePath;
@property(nonatomic,assign)NSInteger maxValue; //最大值
@property(nonatomic,assign)NSInteger count;    //点数
@property(nonatomic,assign)CGFloat avgHeight;  //刻度
@end

@implementation LineChartView
- (instancetype)initWithFrame:(CGRect)frame
{
    self = [super initWithFrame:frame];
    if (self) {
        self.backgroundColor=[UIColor whiteColor];
        _linePath=[CAShapeLayer layer];
        _linePath.lineCap=kCALineCapRound;
        _linePath.lineJoin=kCALineJoinBevel;
        _linePath.lineWidth=1;
        _linePath.fillColor=[UIColor clearColor].CGColor;
        [self.layer addSublayer:_linePath];
        self.bounces=NO;
        self.showsHorizontalScrollIndicator=NO;
        self.showsVerticalScrollIndicator=NO;
        _maxValue=1;
    }
    return self;
}
//最大值
-(NSInteger)maxValue
{
    for (int i=0; i<self.count; i++) {
        NSInteger value=[_dataSource chart:self valueAtIndex:i];
        _maxValue=value>_maxValue?value:_maxValue;
    }
    return _maxValue;
}
//点数
-(NSInteger)count
{
    return [_dataSource numberForChart:self];
}
//刻度
-(CGFloat)avgHeight
{
    CGFloat height=self.frame.size.height;
    _avgHeight=(height-40-20)/self.maxValue;
    return _avgHeight;
}

-(void)drawRect:(CGRect)rect
{
    [super drawRect:rect];
    self.contentSize=CGSizeMake((self.count)*SPACING, self.bounds.size.height);
    //画底部边线

    [self drawVerticalLineStartPoint:CGPointMake(0, self.bounds.size.height-40) withEndPoint:CGPointMake(self.contentSize.width, self.bounds.size.height-40) withColor:[UIColor grayColor] ];

    //画折线
    [self drawBrokenLine];


}
//画底部边线
-(void)drawBottomLine
{
    UIBezierPath *bottomLine=[UIBezierPath bezierPath];
    [bottomLine moveToPoint:CGPointMake(0, self.bounds.size.height-40)];
    [bottomLine addLineToPoint:CGPointMake(self.contentSize.width, self.bounds.size.height-40)];
    [[UIColor colorWithRed:0.902f green:0.902f blue:0.902f alpha:1.00f] setStroke];
    [bottomLine stroke];

}
//画竖线
-(void)drawVerticalLineStartPoint:(CGPoint) startPoint withEndPoint:(CGPoint) endPoint withColor:(UIColor *)color
{
    CAShapeLayer *layer=[CAShapeLayer layer];
    layer.lineCap=kCALineCapRound;
    layer.lineJoin=kCALineJoinBevel;
    layer.lineWidth=0.5;
    layer.fillColor=[UIColor clearColor].CGColor;
    [self.layer addSublayer:layer];

    UIBezierPath *bottomLinePath=[UIBezierPath bezierPath];
    [bottomLinePath moveToPoint:startPoint];
    [bottomLinePath addLineToPoint:endPoint];
    layer.path=bottomLinePath.CGPath;
    layer.strokeColor=[UIColor colorWithRed:0.902f green:0.902f blue:0.902f alpha:1.00f].CGColor;
}

//画点
-(void)drawPointWithCenterPoint:(CGPoint)point radius:(float)radius strokeColor:(UIColor *)strokeColor fillColor:(UIColor *)fillColor
{
    UIBezierPath *drawPoint=[UIBezierPath bezierPath];
    [drawPoint addArcWithCenter:point radius:radius startAngle:M_PI*0 endAngle:M_PI*2 clockwise:YES];
    CAShapeLayer *layer=[[CAShapeLayer alloc]init];
    layer.path=drawPoint.CGPath;
    layer.strokeColor=strokeColor.CGColor;
    layer.fillColor=fillColor.CGColor;
    [self.layer addSublayer:layer];
}

// 画文字 原本使用[NSstring drawAtPoint: withAttributes:]方法 但是画之后并不随着ScrollView滚动 所以用Label
-(void)drawText:(NSString *)text withPoint:(CGPoint)point withType:(TitleType) type withIndex:(NSInteger)index
{

    CGRect frame=[text boundingRectWithSize:CGSizeMake(MAXFLOAT, MAXFLOAT) options:NSStringDrawingUsesLineFragmentOrigin attributes:@{NSFontAttributeName: [UIFont systemFontOfSize:12.f]} context:nil];

    UILabel *label=[[UILabel alloc]init];

    CGPoint pointForValueString=CGPointMake(point.x-15, point.y);
    if (pointForValueString.y+frame.size.height>self.frame.size.height-50) {
        pointForValueString.y=point.y-20;
    }
    else if (pointForValueString.y-frame.size.height<0)
    {
        pointForValueString.y=point.y+frame.size.height;
    }
    label.frame=CGRectMake(pointForValueString.x, pointForValueString.y, 30, 30);
    label.textAlignment=NSTextAlignmentCenter;
    if (type==TitleForPoint) {
        label.textColor=[UIColor redColor];
        label.font=[UIFont systemFontOfSize:12.f];
    }
    else if (type==TitleForX)
    {
        if (_dataSource&&[_dataSource respondsToSelector:@selector(chart:backGroundColorAtXPointIndex:)]) {
            if ([_dataSource chart:self backGroundColorAtXPointIndex:index]) {
                label.backgroundColor=[UIColor redColor];
                label.textColor=[UIColor whiteColor];
            }
        }
        else
        {
            label.textColor=[UIColor colorWithRed:0.298f green:0.298f blue:0.298f alpha:1.00f];
        }
        label.font=[UIFont systemFontOfSize:15.f];
        label.layer.cornerRadius=label.bounds.size.width/2;
        label.clipsToBounds=YES;

    }
    label.text=text;
    [self addSubview:label];
}

-(void)drawBrokenLine
{
     UIBezierPath *path=[UIBezierPath bezierPath];
    for (int i=0; i<self.count; i++) {
        CGFloat value=[_dataSource chart:self valueAtIndex:i];
        CGPoint point=[self pointWithValue:value index:i];

        //画竖线
        [self drawVerticalLineStartPoint:CGPointMake((i+0.5)*SPACING, self.frame.size.height-40) withEndPoint:point withColor:
         [UIColor blueColor]];

        //画折点
        [self drawPointWithCenterPoint:point radius:3 strokeColor:[UIColor redColor] fillColor:self.backgroundColor];

        //画X轴刻度点
        UIColor *pointColor=[UIColor colorWithRed:0.902f green:0.902f blue:0.902f alpha:1.00f];
        [self drawPointWithCenterPoint:CGPointMake((i+0.5)*SPACING, self.bounds.size.height-40) radius:3.5 strokeColor:pointColor fillColor:pointColor];

        //画文字
        NSString *valueString=[NSString stringWithFormat:@"%ld",(long)value];
        [self drawText:valueString withPoint:point withType:TitleForPoint withIndex:i];
        //画X轴
        if (_dataSource&&[_dataSource respondsToSelector:@selector(chart:titleForXLabelAtIndex:)]) {
            NSString *xstring=[_dataSource chart:self titleForXLabelAtIndex:i];
            [self drawText:xstring withPoint:CGPointMake(point.x, self.bounds.size.height-10) withType:TitleForX withIndex:i];
        }

        //画折线
        //贝塞尔曲线
        if (i==0) {
            [path moveToPoint:point];
        }else{
            [path addLineToPoint:point];
        }
    }

    path.lineCapStyle = kCGLineCapRound;
    path.lineJoinStyle=kCGLineJoinRound;
    path.lineWidth=0.5;
    [[UIColor redColor]setStroke];
    CABasicAnimation *pathAnimation=[CABasicAnimation animationWithKeyPath:@"strokeEnd"];
    pathAnimation.duration = 2;
    pathAnimation.timingFunction=[CAMediaTimingFunction functionWithName:kCAMediaTimingFunctionEaseInEaseOut];
    pathAnimation.fromValue=[NSNumber numberWithFloat:0.0f];
    pathAnimation.toValue=[NSNumber numberWithFloat:1.0f];
    pathAnimation.autoreverses=NO;
    _linePath.path=path.CGPath;
    _linePath.strokeColor=[UIColor redColor].CGColor;
    [_linePath addAnimation:pathAnimation forKey:@"strokeEndAnimation"];
    _linePath.strokeEnd = 1.0;
}

//根据索引计算出折点的位置
-(CGPoint)pointWithValue:(NSInteger)value index:(NSInteger)index
{
    CGFloat height=self.frame.size.height;
    return  CGPointMake((index+0.5)*SPACING, height-value*self.avgHeight-40);
}
@end
调用:
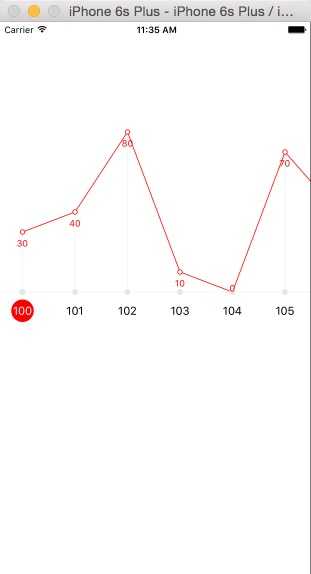
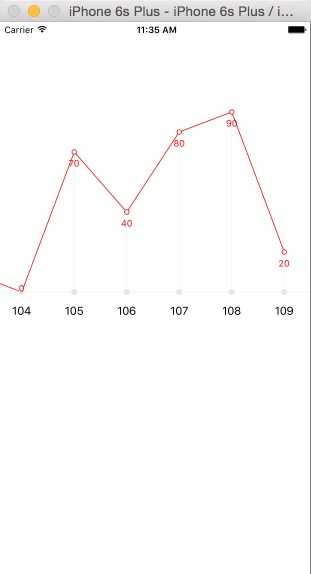
#import "ViewController.h"
#import "LineChartView.h"

@interface ViewController ()<LineChartDataSource>
@property (nonatomic,strong) NSArray *points;
@end

@implementation ViewController

- (void)viewDidLoad {
    [super viewDidLoad];

    _points=@[@30,@40,@80,@10,@0,@70,@40,@80,@90,@20];

    LineChartView *lineChart=[[LineChartView alloc]initWithFrame:CGRectMake(0, 100, self.view.bounds.size.width, 300)];

    lineChart.dataSource=self;

    [self.view addSubview:lineChart];
}

-(NSInteger)numberForChart:(LineChartView *)chart
{
    return _points.count;
}
-(float)chart:(LineChartView *)chart valueAtIndex:(NSInteger)index
{

    return [[_points objectAtIndex:index] floatValue];
}
-(NSString *)chart:(LineChartView *)chart titleForXLabelAtIndex:(NSInteger)index
{
    return [NSString stringWithFormat:@"10%ld",index];
}
-(BOOL)chart:(LineChartView *)chart backGroundColorAtXPointIndex:(NSInteger)index
{
    if (index==0) {
        return true;
    }
    else
    {
        return false;
    }
}

- (void)didReceiveMemoryWarning {
    [super didReceiveMemoryWarning];
    // Dispose of any resources that can be recreated.
}

@end
效果:
标签:
原文地址:http://www.cnblogs.com/5ishare/p/4818739.html