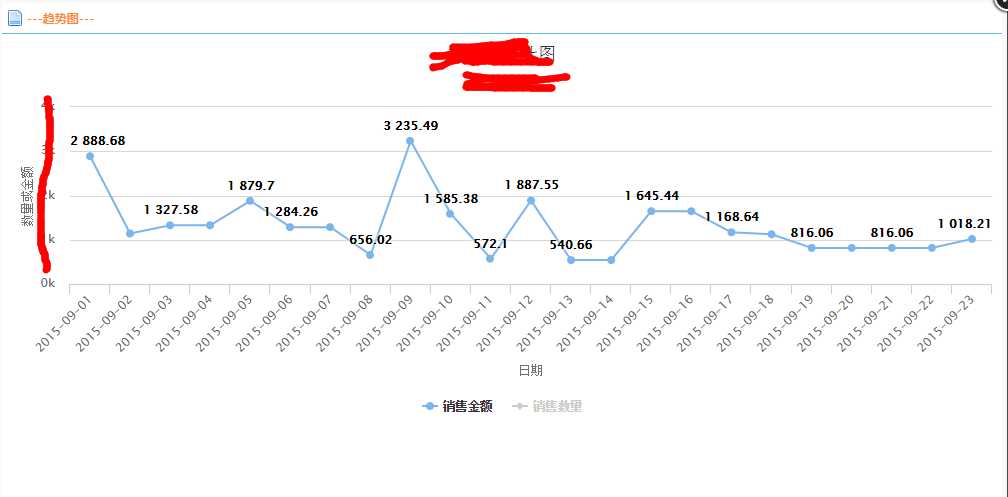
@Scripts.Render("~/bundles/highcharts")
?
<script type="text/javascript">
????$(function () {
????????var option = option = getOption("container", ‘@ViewBag.titletext‘);
????????//生成两个serial
????????option.xAxis.categories = @Html.Raw(@ViewBag.categories)
????????option.series[0].data = @ViewBag.amount
????????option.series[1].data = @ViewBag.quantity
????????option.subtitle.text = ‘@ViewBag.subtitle‘
?
????????chart = new Highcharts.Chart(option);
?
????????$("text:contains(‘销售数量‘)").trigger(‘click‘);
????});
?
????function getOption(container, title) {
????????var options = {
????????????chart: {
????????????????renderTo: container,
????????????????type: ‘line‘
????????????},
????????????title: {
????????????????text: title
????????????},
????????????subtitle: {
????????????????text: ‘imc‘
????????????},
????????????xAxis: {
????????????????title: {
????????????????????text: ‘日期‘
????????????????}
????????????},
????????????yAxis: {
????????????????title: {
????????????????????text: ‘数量或金额‘
????????????????},
????????????????min: 0, // 定义最小值
????????????},
????????????plotOptions: {
????????????????line: {
????????????????????dataLabels: {
????????????????????????enabled: true
????????????????????}
????????????????}
????????????},
????????????tooltip: {
????????????????shared: true, //共享数据提示框
????????????},
????????????credits: {
????????????????enabled: false
????????????},
????????????series: [{
????????????????name: "销售金额"
????????????}, {
????????????????name: "销售数量"
????????????}]
????????}
?
????????return options;
????}
?
</script>
