标签:
1、安装
yum install dstat
2、示例
1)直接跟数字,表示#秒收集一次数据,默认为一秒;dstat 5表示5秒更新一次
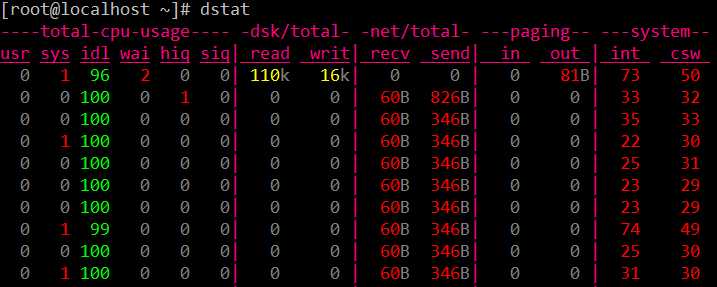
这是默认输出显示的信息:
CPU状态:CPU的使用率。这项报告更有趣的部分是显示了用户,系统和空闲部分,这更好地分析了CPU当前的使用状况。如果你看到"wait"一栏中,CPU的状态是一个高使用率值,那说明系统存在一些其它问题。当CPU的状态处在"waits"时,那是因为它正在等待I/O设备(例如内存,磁盘或者网络)的响应而且还没有收到。
磁盘统计:磁盘的读写操作,这一栏显示磁盘的读、写总数。
网络统计:网络设备发送和接受的数据,这一栏显示的网络收、发数据总数。
分页统计:系统的分页活动。分页指的是一种内存管理技术用于查找系统场景,一个较大的分页表明系统正在使用大量的交换空间,或者说内存非常分散,大多数情况下你都希望看到page in(换入)和page out(换出)的值是0 0。
系统统计:这一项显示的是中断(int)和上下文切换(csw)。这项统计仅在有比较基线时才有意义。这一栏中较高的统计值通常表示大量的进程造成拥塞,需要对CPU进行关注。你的服务器一般情况下都会运行运行一些程序,所以这项总是显示一些数值。
默认情况下,dstat每秒都会刷新数据。如果想退出dstat,你可以按"CTRL-C"键。
需要注意的是报告的第一行,通常这里所有的统计都不显示数值的。
这是由于dstat会通过上一次的报告来给出一个总结,所以第一次运行时是没有平均值和总值的相关数据。
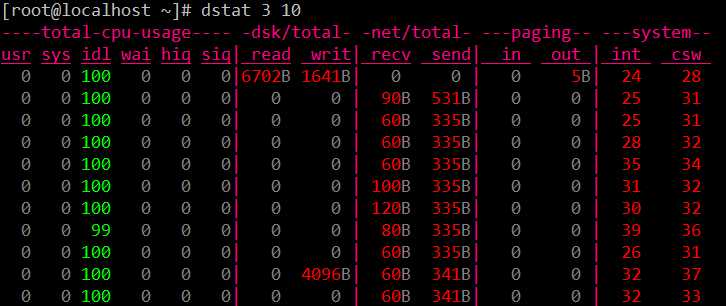
2)但是dstat可以通过传递2个参数运行来控制报告间隔和报告数量。例如,如果你想要dstat输出默认监控、报表输出的时间间隔为3秒钟,并且报表中输出10个结果,你可以运行如下命令:
在dstat命令中有很多参数可选,你可以通过man dstat命令查看,大多数常用的参数有这些:
Versatile tool for generating system resource statistics

Dstat options:
  -c, --cpu              enable cpu stats
     -C 0,3,total           include cpu0, cpu3 and total
  -d, --disk             enable disk stats
     -D total,hda           include hda and total
  -g, --page             enable page stats
  -i, --int              enable interrupt stats
     -I 5,eth2              include int5 and interrupt used by eth2
  -l, --load             enable load stats
  -m, --mem              enable memory stats
  -n, --net              enable network stats
     -N eth1,total          include eth1 and total
  -p, --proc             enable process stats
  -r, --io               enable io stats (I/O requests completed)
  -s, --swap             enable swap stats
     -S swap1,total         include swap1 and total
  -t, --time             enable time/date output
  -T, --epoch            enable time counter (seconds since epoch)
  -y, --sys              enable system stats

  --aio                  enable aio stats
  --fs, --filesystem     enable fs stats
  --ipc                  enable ipc stats
  --lock                 enable lock stats
  --raw                  enable raw stats
  --socket               enable socket stats
  --tcp                  enable tcp stats
  --udp                  enable udp stats
  --unix                 enable unix stats
  --vm                   enable vm stats

  --plugin-name          enable plugins by plugin name (see manual)
  --list                 list all available plugins

  -a, --all              equals -cdngy (default)
  -f, --full             automatically expand -C, -D, -I, -N and -S lists
  -v, --vmstat           equals -pmgdsc -D total

  --bw, --blackonwhite   change colors for white background terminal
  --float                force float values on screen
  --integer              force integer values on screen
  --nocolor              disable colors (implies --noupdate)
  --noheaders            disable repetitive headers
  --noupdate             disable intermediate updates
  --output file          write CSV output to file
参数解释
-nocolor :不显示颜色(有时候有用)
-socket :显示网络统计数据
-tcp :显示常用的TCP统计
-udp :显示监听的UDP接口及其当前用量的一些动态数据
-c,--cpu 统计CPU状态,包括 user, system, idle(空闲等待时间百分比), wait(等待磁盘IO), hardware interrupt(硬件中断), software interrupt(软件中断)等;
-d, --disk 统计磁盘读写状态
-D total,sda 统计指定磁盘或汇总信息
-l, --load 统计系统负载情况,包括1分钟、5分钟、15分钟平均值
-m, --mem 统计系统物理内存使用情况,包括used, buffers, cache, free
-s, --swap 统计swap已使用和剩余量
-n, --net 统计网络使用情况,包括接收和发送数据
-N eth1,total 统计eth1接口汇总流量
-r, --io 统计I/O请求,包括读写请求
-p, --proc 统计进程信息,包括runnable、uninterruptible、new
-y, --sys 统计系统信息,包括中断、上下文切换
-t 显示统计时时间,对分析历史数据非常有用
一些插件
internal:
        aio, cpu, cpu24, disk, disk24, disk24old, epoch, fs, int, int24, io, ipc, load, lock, mem, net, page, page24, proc, raw,
        socket, swap, swapold, sys, tcp, time, udp, unix, vm
/usr/share/dstat:
        battery, battery-remain, cpufreq, dbus, disk-util, fan, freespace, gpfs, gpfs-ops, helloworld, innodb-buffer, innodb-io,
        innodb-ops, lustre, memcache-hits, mysql-io, mysql-keys, mysql5-cmds, mysql5-conn, mysql5-io, mysql5-keys, net-packets,
        nfs3, nfs3-ops, nfsd3, nfsd3-ops, ntp, postfix, power, proc-count, rpc, rpcd, sendmail, snooze, thermal, top-bio, top-cpu,
        top-cputime, top-cputime-avg, top-io, top-latency, top-latency-avg, top-mem, top-oom, utmp, vm-memctl, vmk-hba, vmk-int,
        vmk-nic, vz-cpu, vz-io, vz-ubc, wifi
参数解释
--disk-util :显示某一时间磁盘的忙碌状况
--freespace :显示当前磁盘空间使用率
--proc-count :显示正在运行的程序数量
--top-bio :指出块I/O最大的进程
--top-cpu :图形化显示CPU占用最大的进程
--top-io :显示正常I/O最大的进程
--top-mem :显示占用最多内存的进程
--fs 统计文件打开数和inodes数
举一些例子:
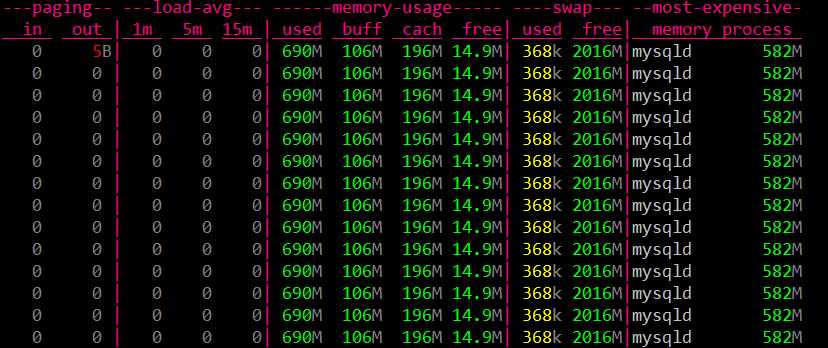
内存谁在占用
dstat -g -l -m -s --top-mem
CPU资源损耗
dstat -c -y -l --proc-count --top-cpu
想输出一个csv格式的文件用于以后,可以通过下面的命令:
dstat –output /tmp/sampleoutput.csv -cdn

标签:
原文地址:http://www.cnblogs.com/chenpingzhao/p/4856055.html