标签:
使用DBCC Show_Statistics 能够查看 表或Indexed view上的统计信息。Query optimizer使用统计信息进行estimate,生成高质量的qeury plan。统计信息不是实时更新的,如果统计信息过期,Query optimizer可能不能生成高质量的query plan,所以,可以通过DBCC Show_Statistics查看统计信息最后一次更新的日期,并手动更新统计信息,以使query optimizer依据正确的统计信息生成高效的query plan。更新统计信息确保查询使用最新的统计信息编译。不过,更新统计信息会导致查询重新编译。我们建议不要太频繁地更新统计信息,因为需要在改进查询计划和重新编译查询所用时间之间权衡性能。
Updating statistics ensures that queries compile with up-to-date statistics. However, updating statistics causes queries to recompile. We recommend not updating statistics too frequently because there is a performance tradeoff between improving query plans and the time it takes to recompile queries.
Syntax
DBCC SHOW_STATISTICS ( table_or_indexed_view_name , target )
[ WITH [ NO_INFOMSGS ] < option > [ , n ] ]
< option > :: =
    STAT_HEADER | DENSITY_VECTOR | HISTOGRAM | STATS_STREAM
target
Name of the index, statistics, or column for which to display statistics information. If target is a name of an existing index or statistics on a table or indexed view, the statistics information about this target is returned. If target is the name of an existing column, and an automatically created statistics on this column exists, information about that auto-created statistic is returned. If an automatically created statistic does not exist for a column target, error message 2767 is returned.
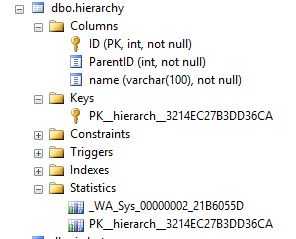
在SSMS中打开Table的“+”号,能看到Statistics的Category,这就是Sql Server为该表生成的Statistics 信息。

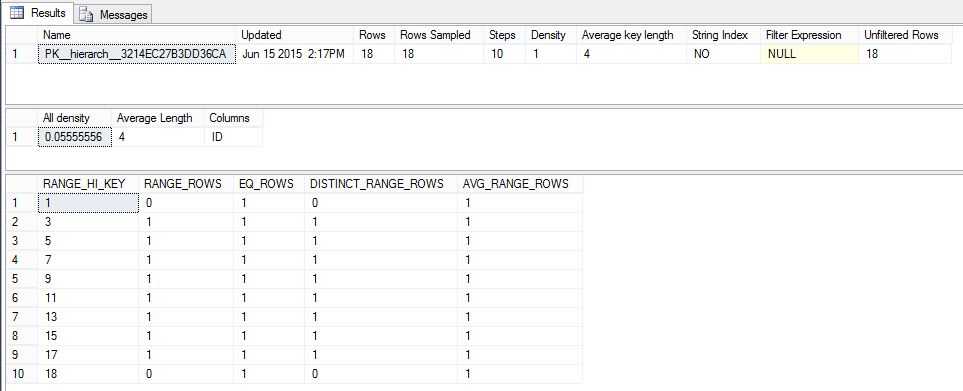
要查看[PK__hierarch__3214EC27B3DD36CA]的统计信息的详情,可以使用DBCC Show_Statistics语句
DBCC SHOW_STATISTICS(‘[dbo].[hierarchy]‘,[PK__hierarch__3214EC27B3DD36CA])

统计信息包括三部分:a header with metadata about the statistics,a histogram with the distribution of values in the first key column of the statistics object, and a density vector to measure cross-column correlation.
第一个表是Header表,有几个非常重要的字段
Updated是统计最后更新的时间(Date and time the statistics were last updated),通过该字段,可以判断统计信息是否过期。
Rows是统计最后一次更新时,表或Indexed View中的数据行数目。Total number of rows in the table or indexed view when the statistics were last updated。
第二个表是Density Vector,用于Key Column的密度分析,计算公式非常简单,Density is 1 / distinct values。
Results display density for each prefix of columns in the statistics object, one row per density. A distinct value is a distinct list of the column values per row and per columns prefix. For example, if the statistics object contains key columns (A, B, C), the results report the density of the distinct lists of values in each of these column prefixes: (A), (A,B), and (A, B, C). Using the prefix (A, B, C), each of these lists is a distinct value list: (3, 5, 6), (4, 4, 6), (4, 5, 6), (4, 5, 7). Using the prefix (A, B) the same column values have these distinct value lists: (3, 5), (4, 4), and (4, 5)。
第三个表是Histogram,使用Target的第一个key column来统计
示例
1,创建示例表数据
if object_id(‘dbo.dt_test‘) is not null
    drop table dbo.dt_test

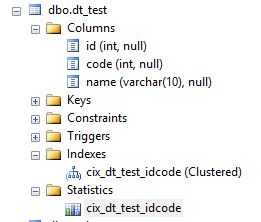
create table dbo.dt_test
(
id int,
code int,
name varchar(10)
)

create clustered index cix_dt_test_idcode
on dbo.dt_test(id,code)

insert into dbo.dt_test
values(1,1,‘a‘),(1,2,‘b‘),
(2,1,‘c‘),(2,2,‘d‘),
(3,1,‘e‘),(3,2,‘f‘)

2,查看索引的统计信息
dbcc show_statistics(‘dbo.dt_test‘,[cix_dt_test_idcode])

第一个表Updated字段是Null,说明并没有进行统计信息的更新
3,统计信息的更新
首先查看系统是否允许自动更新统计信息
SELECT  name AS dbName,
        is_auto_create_stats_on AS ‘Auto Create Stats‘,
        is_auto_update_stats_on AS ‘Auto Update Stats‘,
        is_read_only AS ‘Read Only‘
FROM sys.databases
WHERE database_ID =db_id();

手动更新统计信息
update statistics dbo.dt_test [cix_dt_test_idcode]
4,查看和分析统计信息
dbcc show_statistics(‘dbo.dt_test‘,[cix_dt_test_idcode])

4.1分析Density Vector,All Density字段,当Columns=id时共有三个distinct ID值,All Density=1/3,
当Columns=id,Code时共有6个Distinct (ID,Code),All Density=1/6
4.2 分析Histogram,Sql Server使用统计对象的First Key column进行统计,Histogram按照Range统计信息,每一个range包含很多列,每一个Range单独计算DISTINCT_RANGE_ROWS 和AVG_RANGE_ROWS 等统计信息。
A histogram measures the frequency of occurrence for each distinct value in a data set. The query optimizer computes a histogram on the column values in the first key column of the statistics object, selecting the column values by statistically sampling the rows or by performing a full scan of all rows in the table or view. If the histogram is created from a sampled set of rows, the stored totals for number of rows and number of distinct values are estimates and do not need to be whole integers.
Range_HI_Key是Range的上边界,
EQ_Rows是first key column等于Range_HI_Key的record的数目,
Range_Rows是本Range的Record的数目,计算公式是<本记录的Range_HI_Key,>上条记录的Range_HI_Key。
|
Column name |
Description |
|---|---|
|
RANGE_HI_KEY |
Upper bound column value for a histogram step. The column value is also called a key value. |
|
RANGE_ROWS |
Estimated number of rows whose column value falls within a histogram step, excluding the upper bound. |
|
EQ_ROWS |
Estimated number of rows whose column value equals the upper bound of the histogram step. |
|
DISTINCT_RANGE_ROWS |
Estimated number of rows with a distinct column value within a histogram step, excluding the upper bound. |
|
AVG_RANGE_ROWS |
Average number of rows with duplicate column values within a histogram step, excluding the upper bound (RANGE_ROWS / DISTINCT_RANGE_ROWS for DISTINCT_RANGE_ROWS > 0). |
To create the histogram, the query optimizer sorts the column values, computes the number of values that match each distinct column value and then aggregates the column values into a maximum of 200 contiguous histogram steps. Each step includes a range of column values followed by an upper bound column value. The range includes all possible column values between boundary values, excluding the boundary values themselves. The lowest of the sorted column values is the upper boundary value for the first histogram step.
参照MSDN文章
DBCC SHOW_STATISTICS displays current query optimization statistics for a table or indexed view. The query optimizer uses statistics to estimate the cardinality or number of rows in the query result, which enables the query optimizer to create a high quality query plan. For example, the query optimizer could use cardinality estimates to choose the index seek operator instead of the index scan operator in the query plan, improving query performance by avoiding a resource-intensive index scan.
The query optimizer stores statistics for a table or indexed view in a statistics object. For a table, the statistics object is created on either an index or a list of table columns. The statistics object includes a header with metadata about the statistics, a histogram with the distribution of values in the first key column of the statistics object, and a density vector to measure cross-column correlation. The Database Engine can compute cardinality estimates with any of the data in the statistics object.
DBCC SHOW_STATISTICS displays the header, histogram, and density vector based on data stored in the statistics object. The syntax lets you specify a table or indexed view along with a target index name, statistics name, or column name. This topic describes how to display the statistics and how to understand the displayed results.
Syntax
DBCC SHOW_STATISTICS ( table_or_indexed_view_name , target )
[ WITH [ NO_INFOMSGS ] < option > [ , n ] ]
< option > :: =
    STAT_HEADER | DENSITY_VECTOR | HISTOGRAM | STATS_STREAM
Arguments
Result Sets
The following table describes the columns returned in the result set when STAT_HEADER is specified.
|
Column name |
Description |
|---|---|
|
Name |
Name of the statistics object. |
|
Updated |
Date and time the statistics were last updated. The STATS_DATE function is an alternate way to retrieve this information. |
|
Rows |
Total number of rows in the table or indexed view when the statistics were last updated. If the statistics are filtered or correspond to a filtered index, the number of rows might be less than the number of rows in the table. For more information, seeStatistics. |
|
Rows Sampled |
Total number of rows sampled for statistics calculations. If Rows Sampled < Rows, the displayed histogram and density results are estimates based on the sampled rows. |
|
Steps |
Number of steps in the histogram. Each step spans a range of column values followed by an upper bound column value. The histogram steps are defined on the first key column in the statistics. The maximum number of steps is 200. |
|
Density |
Calculated as 1 / distinct values for all values in the first key column of the statistics object, excluding the histogram boundary values. This Density value is not used by the query optimizer and is displayed for backward compatibility with versions before SQL Server 2008. |
|
Average Key Length |
Average number of bytes per value for all of the key columns in the statistics object. |
|
String Index |
Yes indicates the statistics object contains string summary statistics to improve the cardinality estimates for query predicates that use the LIKE operator; for example, WHERE ProductName LIKE ‘%Bike‘. String summary statistics are stored separately from the histogram and are created on the first key column of the statistics object when it is of type char, varchar, nchar, nvarchar, varchar(max), nvarchar(max), text, or ntext.. |
|
Filter Expression |
Predicate for the subset of table rows included in the statistics object. NULL = non-filtered statistics. For more information about filtered predicates, see Create Filtered Indexes. For more information about filtered statistics, see Statistics. |
|
Unfiltered Rows |
Total number of rows in the table before applying the filter expression. If Filter Expression is NULL, Unfiltered Rows is equal to Rows. |
The following table describes the columns returned in the result set when DENSITY_VECTOR is specified.
|
Column name |
Description |
|---|---|
|
All Density |
Density is 1 / distinct values. Results display density for each prefix of columns in the statistics object, one row per density. A distinct value is a distinct list of the column values per row and per columns prefix. For example, if the statistics object contains key columns (A, B, C), the results report the density of the distinct lists of values in each of these column prefixes: (A), (A,B), and (A, B, C). Using the prefix (A, B, C), each of these lists is a distinct value list: (3, 5, 6), (4, 4, 6), (4, 5, 6), (4, 5, 7). Using the prefix (A, B) the same column values have these distinct value lists: (3, 5), (4, 4), and (4, 5) |
|
Average Length |
Average length, in bytes, to store a list of the column values for the column prefix. For example, if the values in the list (3, 5, 6) each require 4 bytes the length is 12 bytes. |
|
Columns |
Names of columns in the prefix for which All density and Average length are displayed. |
The following table describes the columns returned in the result set when the HISTOGRAM option is specified.
|
Column name |
Description |
|---|---|
|
RANGE_HI_KEY |
Upper bound column value for a histogram step. The column value is also called a key value. |
|
RANGE_ROWS |
Estimated number of rows whose column value falls within a histogram step, excluding the upper bound. |
|
EQ_ROWS |
Estimated number of rows whose column value equals the upper bound of the histogram step. |
|
DISTINCT_RANGE_ROWS |
Estimated number of rows with a distinct column value within a histogram step, excluding the upper bound. |
|
AVG_RANGE_ROWS |
Average number of rows with duplicate column values within a histogram step, excluding the upper bound (RANGE_ROWS / DISTINCT_RANGE_ROWS for DISTINCT_RANGE_ROWS > 0). |
A histogram measures the frequency of occurrence for each distinct value in a data set. The query optimizer computes a histogram on the column values in the first key column of the statistics object, selecting the column values by statistically sampling the rows or by performing a full scan of all rows in the table or view. If the histogram is created from a sampled set of rows, the stored totals for number of rows and number of distinct values are estimates and do not need to be whole integers.
To create the histogram, the query optimizer sorts the column values, computes the number of values that match each distinct column value and then aggregates the column values into a maximum of 200 contiguous histogram steps. Each step includes a range of column values followed by an upper bound column value. The range includes all possible column values between boundary values, excluding the boundary values themselves. The lowest of the sorted column values is the upper boundary value for the first histogram step.
The following diagram shows a histogram with six steps. The area to the left of the first upper boundary value is the first step.

For each histogram step:
Bold line represents the upper boundary value (RANGE_HI_KEY) and the number of times it occurs (EQ_ROWS)
Solid area left of RANGE_HI_KEY represents the range of column values and the average number of times each column value occurs (AVG_RANGE_ROWS). The AVG_RANGE_ROWS for the first histogram step is always 0.
Dotted lines represent the sampled values used to estimate total number of distinct values in the range (DISTINCT_RANGE_ROWS) and total number of values in the range (RANGE_ROWS). The query optimizer uses RANGE_ROWS and DISTINCT_RANGE_ROWS to compute AVG_RANGE_ROWS and does not store the sampled values.
The query optimizer defines the histogram steps according to their statistical significance. It uses a maximum difference algorithm to minimize the number of steps in the histogram while maximizing the difference between the boundary values. The maximum number of steps is 200. The number of histogram steps can be fewer than the number of distinct values, even for columns with fewer than 200 boundary points. For example, a column with 100 distinct values can have a histogram with fewer than 100 boundary points.
The query optimizer uses densities to enhance cardinality estimates for queries that return multiple columns from the same table or indexed view. The density vector contains one density for each prefix of columns in the statistics object. For example, if a statistics object has the key columns CustomerId, ItemId, Price, density is calculated on each of the following column prefixes.
|
Column prefix |
Density calculated on |
|---|---|
|
(CustomerId) |
Rows with matching values for CustomerId |
|
(CustomerId, ItemId) |
Rows with matching values for CustomerId and ItemId |
|
(CustomerId, ItemId, Price) |
Rows with matching values for CustomerId, ItemId, and Price |
DBCC SHOW_STATISTICS does not provide statistics for spatial or xVelocity memory optimized columnstore indexes.
参照MSDN
https://msdn.microsoft.com/en-us/library/ms174384(v=sql.110).aspx
标签:
原文地址:http://www.cnblogs.com/ljhdo/p/4874785.html