标签:
感谢原作者分享:https://github.com/shevchenhe/ChartLayer,在使用的过程中,需要自己进行调试修改,主要还是_draw函数,不同的ArcGIS JS API函数有差异,会出错。
首先是是扩展GraphicLayer
dojo.provide("sggchart.SggChartLayer");
dojo.require("dojox.gfx");
dojo.require("esri.geometry");
dojo.require("dojo.Stateful");

dojo.declare("sggchart.SggChartLayer", esri.layers.GraphicsLayer, {
    divid: null,
    bindGraphicLayer:null,
    constructor:function(params){
        dojo.mixin(this,params);
    },
    setDivId: function(id) {
        this.divid = id;
    },
    _draw: function(graphic, redraw, zoomFlag) {
        var that=this;
        if (!this._map) {
            return;
        }

        if (graphic instanceof sggchart.SggPieChart) {
            //if (!zoomFlag) {
                this._drawChart(graphic, zoomFlag);
           // } else {
            //    dojo.connect(that.bindGraphicLayer,"onUpdateEnd",dojo.hitch(that,that._drawChart,graphic, zoomFlag)
          //  }
        }
    },
    hide: function() {
        var length = this.graphics.length;
        var thisgraphics = this.graphics;
        for (var i = 0; i < length; i++) {
            if (thisgraphics[i].parentDiv) {
                dojo.style(thisgraphics[i].parentDiv, {
                    "display": "none"
                });
            }
        }
    },
    show: function() {
        var length = this.graphics.length;
        var thisgraphics = this.graphics;
        for (var i = 0; i < length; i++) {
            if (thisgraphics[i].parentDiv) {
                dojo.style(thisgraphics[i].parentDiv, {
                    "display": ""
                });
            }
        }
    },
    _onPanStartHandler: function() {
        this.hide();
    },
    _onPanEndHandler: function() {

        this._refresh(false);
        //this._visibilityChangeHandler(this.visible);

        // if (this.graphics.length) {
        //   this.onUpdate();
        // }
    },
    _onZoomStartHandler:function(){
        this.hide();
    },
    _refresh: function(redraw, zoomFlag) {
        var gs = this.graphics,
            il = gs.length,
            i,
            _draw = this._draw;
        if (!redraw) {
            for (i = 0; i < gs.length; i++) {
                _draw(gs[i], redraw, zoomFlag);
                //this.remove(gs[i]);
            }
        } else {
            for (i = 0; i < gs.length; i++) {
                _draw(gs[i], redraw, zoomFlag);
            }
        }
        this.show();
    },
    _onExtentChangeHandler: function(extent, delta, levelChange, lod) {
        if (levelChange) {
            //summary: Redraw graphics on extent change
            // var _mvr = this._map.__visibleRect,
            //     group = this._div;
            // this._init = true;

            this._refresh(true, levelChange);

            // group.setTransform(dojox.gfx.matrix.translate({
            //     x: _mvr.x,
            //     y: _mvr.y
            // }));

            // if (this._renderProto && group.surface.pendingRender) { // canvas
            //     this._dirty = true;
            // } else {
            //     if (this.visible) {
            //         esri.show(group.getEventSource());
            //     }
            // }
        }
    },
    _drawChart: function(piegraphic, zoomFlag) {
        //var bindGraphic = piegraphic.piegraphic.bindGraphic;
        if (!piegraphic.bindGraphic) {
            return;
        }
        if (zoomFlag) {
            dojo.byId(this.divid).removeChild(piegraphic.parentDiv);
            //dojo.connect()
            //this.remove(piegraphic);
        }
        //var graphicDojoShapeStateful=new dojo.Stateful();
        //graphicDojoShapeStateful.watch
        //理论上需要利用多边形的重心的
        if (piegraphic.bindGraphic.visible && piegraphic.bindGraphic._extent && (offsets = this._intersects(this._map, piegraphic.bindGraphic._extent, piegraphic.bindGraphic.geometry._originOnly))) {
            if (piegraphic.bindGraphic._shape) {
                var svgDojoShape = piegraphic.bindGraphic.getDojoShape();
                var svgx = svgDojoShape.bbox.l;
                var svgy = svgDojoShape.bbox.t;
                piegraphic.divWidth = svgDojoShape.bbox.r - svgx;
                piegraphic.divHeight = svgDojoShape.bbox.b - svgy;
                var svgtransform = svgDojoShape.parent.matrix;
                var piedivx = svgx + svgtransform.dx;
                var piedivy = svgy + svgtransform.dy;
                if (!piegraphic.parentDiv||zoomFlag) {
                    var piediv = dojo.doc.createElement("div");
                    dojo.style(piediv, {
                        "left": piedivx + "px",
                        "top": piedivy + "px",
                        "position": "absolute",
                        "width": piegraphic.getDivWidth() + "px",
                        "height": piegraphic.getDivHeight() + "px",
                        "margin": "0px",
                        "padding": "0px",
                        "z-index": "100"
                    });
                    debugger;
                    dojo.byId(this.divid).appendChild(piediv);
                    piegraphic._draw(piediv);
                    piegraphic.parentDiv = piediv;
                } else if (piegraphic.parentDiv) {
                    dojo.style(piegraphic.parentDiv, {
                        "left": piedivx + "px",
                        "top": piedivy + "px",
                        "position": "absolute",
                        "width": piegraphic.getDivWidth() + "px",
                        "height": piegraphic.getDivHeight() + "px",
                        "margin": "0px",
                        "padding": "0px",
                        "z-index": "100"
                    });
                }
            }


            //var mapGraphic= esri.geometry.toMapGeometry(this._map.extent,this._map.width,this._map.height,piegraphic.bindGraphic.geometry.getExtent);
            //} else if (!piegraphic.bindGraphic._shape && piegraphic.parentDiv) {
        } else {
            dojo.byId(this.divid).removeChild(piegraphic.parentDiv);
            piegraphic.parentDiv=null;
            //this.remove(piegraphic);
        }


    }
});
然后扩展Graphic进行图表的绘制,此处使用的是dojo图表,建议使用highCharts
dojo.provide("sggchart.SggChartGraphics");
dojo.require("dojox.charting.Chart");
dojo.require("dojox.charting.plot2d.Pie");
dojo.require("dojox.charting.themes.Claro");
dojo.require("dojox.charting.themes.PlotKit.green");
dojo.require("dojox.charting.themes.Tufte");
dojo.require("dojox.charting.themes.CubanShirts");
dojo.require("dojox.charting.action2d.MoveSlice");
dojo.require("dojox.charting.action2d.Tooltip");
dojo.require("dojox.charting.widget.Legend");
//dojo.require("dojo.Stateful");


dojo.declare("sggchart.SggChartGraphics", esri.Graphic, {
    bindGraphic: null,
    parentDiv: null,
    series: null,
    id: null,
    divHeight: null,
    divWidth: null,
    map: null,
    setId: function(id) {
        this.id = id;
    },
    setSeries: function(series) {
        this.series = series;
    },
    setDivHeight: function(height) {
        this.divHeight = height;
    },
    setDivWidth: function(width) {
        this.divWidth = width;
    },
    getDivHeight: function() {
        return this.divHeight;
    },
    getDivWidth: function() {
        return this.divWidth;
    },
    getSeries: function() {
        return this.series;
    },
    getId: function() {
        return this.id;
    },
    hide: function() {
        if (this.parentDiv) {
            dojo.style(this.parentDiv, "display", "none");
        }
    },
    show: function() {
        if (this.parentDiv) {
            dojo.style(this.parentDiv, "display", "");
        }
    },
    _getMap: function() {
        var gl = this._graphicsLayer;
        return gl._map;
    }
});

dojo.declare("sggchart.SggPieChart", sggchart.SggChartGraphics, {
    watchobject:null,
    constructor: function(graphic) {
        dojo.mixin(this, {
            bindGraphic: graphic
        });
        //var tempwatch=new dojo.Stateful();
        //this.watchobject=tempwatch;
    },

    _draw: function(divContainer) {
        var _chart = new dojox.charting.Chart(divContainer);
        //var r = this.divWidth / 2;
        var r=50;
        var thetheme1=dojox.charting.themes.PlotKit.green;
        thetheme1.chart.fill = "transparent";
        thetheme1.chart.stroke = "transparent";
        thetheme1.plotarea.fill = "transparent";

        _chart.setTheme(thetheme1).
        addPlot("default", {
            type: dojox.charting.plot2d.Pie,
            radius: r
        }).
        addSeries(this.getId(), this.getSeries());
        new dojox.charting.action2d.Tooltip(_chart, "default");
        new dojox.charting.action2d.MoveSlice(_chart, "default");
        _chart.render();
        this.chart = _chart;
    }
});

/*dojo.declare("SggBarChart",SggChartGraphics,{
    _draw:function(divContainer){
        var _chart=new dojox.charting.Chart(divContainer);

    }
})*/
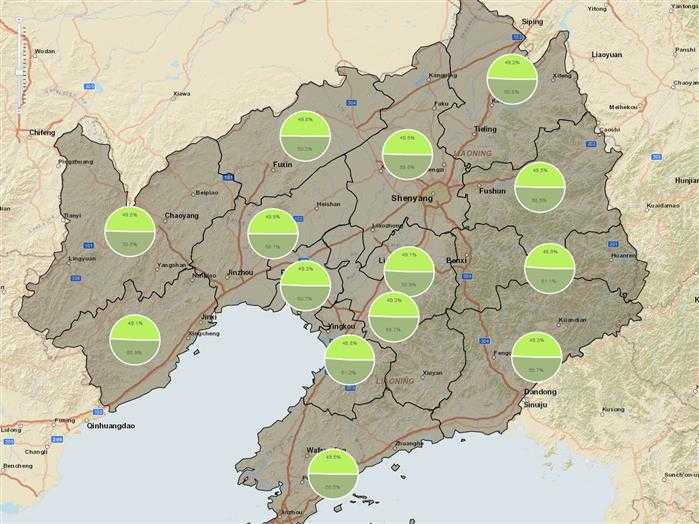
基于ArcGIS API for JavaScript的统计图表实现
标签:
原文地址:http://www.cnblogs.com/hyqing/p/4893963.html