标签:
data<-‘F:\\learning\\ML_for_Hackers\\ML_for_Hackers-master\\06-Regularization\\data\\‘
ranks <- read.csv(file.path(data, ‘oreilly.csv‘),stringsAsFactors = FALSE)
library(‘tm‘)
documents <- data.frame(Text = ranks$Long.Desc.)
row.names(documents) <- 1:nrow(documents)
#获得语料库
corpus <- Corpus(DataframeSource(documents))
#R2版本用corpus <- tm_map(corpus, tolower)
corpus <- tm_map(corpus, content_transformer(tolower))
#R2版本用corpus <- tm_map(corpus, stripWhitespace)
corpus <- tm_map(corpus, content_transformer(stripWhitespace))
#去除英文停用词
corpus <- tm_map(corpus, removeWords, stopwords(‘english‘))
#得到词项文档矩阵
dtm <- DocumentTermMatrix(corpus)
x <- as.matrix(dtm)
y <- rev(1:100) #反转1..100,结果是100..1
set.seed(1)
library(‘glmnet‘)
performance <- data.frame()
for (lambda in c(0.1, 0.25, 0.5, 1, 2, 5))
{
for (i in 1:50)
{
indices <- sample(1:100, 80)
training.x <- x[indices, ]
training.y <- y[indices]
test.x <- x[-indices, ]
test.y <- y[-indices]
glm.fit <- glmnet(training.x, training.y)
predicted.y <- predict(glm.fit, test.x, s = lambda)
rmse <- sqrt(mean((predicted.y - test.y) ^ 2))
performance <- rbind(performance,data.frame(Lambda = lambda,Iteration = i,RMSE = rmse))
}
}
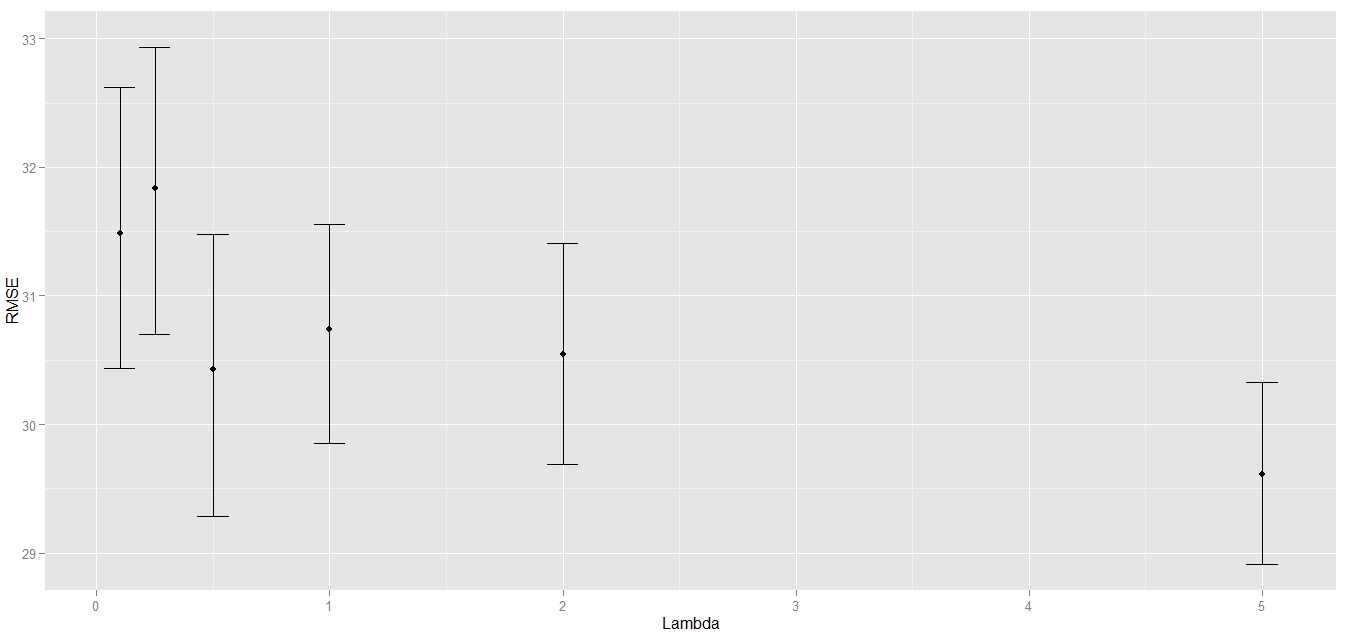
ggplot(performance, aes(x = Lambda, y = RMSE)) +stat_summary(fun.data = ‘mean_cl_boot‘, geom = ‘errorbar‘) +
stat_summary(fun.data = ‘mean_cl_boot‘, geom = ‘point‘)
#从图上看,失败

#失败了作分类,判断一本书能不能进前50
y <- rep(c(1, 0), each = 50)
#作逻辑回归
regularized.fit <- glmnet(x, y, family = ‘binomial‘)
#预测一下
predict(regularized.fit, newx = x, s = 0.001)
#出来的结果并不是分类,而是一堆数值,因此改一下
ifelse(predict(regularized.fit, newx = x, s = 0.001) > 0, 1, 0)
#第二种方法,把预测结果转成概率值
library(‘boot‘)
inv.logit(predict(regularized.fit, newx = x, s = 0.001))
#看效果
set.seed(1)
performance <- data.frame()
for (i in 1:250)
{
indices <- sample(1:100, 80)
training.x <- x[indices, ]
training.y <- y[indices]
test.x <- x[-indices, ]
test.y <- y[-indices]
for (lambda in c(0.0001, 0.001, 0.0025, 0.005, 0.01, 0.025, 0.5, 0.1))
{
glm.fit <- glmnet(training.x, training.y, family = ‘binomial‘)
predicted.y <- ifelse(predict(glm.fit, test.x, s = lambda) > 0, 1, 0)
error.rate <- mean(predicted.y != test.y)
performance <- rbind(performance,data.frame(Lambda = lambda,Iteration = i,ErrorRate = error.rate))
}
}
#画个图
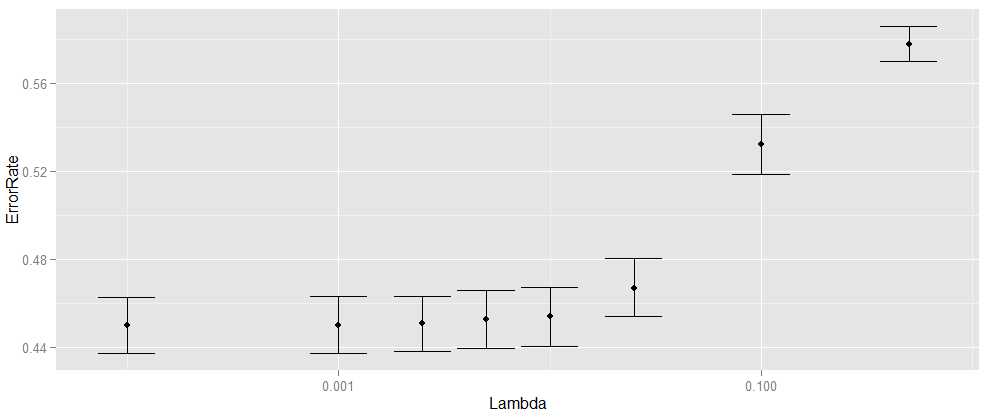
ggplot(performance, aes(x = Lambda, y = ErrorRate)) +
stat_summary(fun.data = ‘mean_cl_boot‘, geom = ‘errorbar‘) +
stat_summary(fun.data = ‘mean_cl_boot‘, geom = ‘point‘) +scale_x_log10()

Machine Learning for hackers读书笔记(六)正则化:文本回归
标签:
原文地址:http://www.cnblogs.com/MarsMercury/p/4908866.html