标签:
asp.net chart之饼图
开发环境VS2010 chart控件是vs自带控件
前台:
 1                             <asp:Chart ID="Chart3" runat="server" Width="900px">
 2                             <Legends>
 3                                 <asp:Legend BackColor="Transparent" Alignment="Center" Font="Trebuchet MS, 8.25pt, style=Bold"
 4                                     IsTextAutoFit="False" Name="Default" LegendStyle="Column">
 5                                 </asp:Legend>
 6                             </Legends>
 7                             <ChartAreas>
 8                                 <asp:ChartArea Name="ChartArea1">
 9                                     <Area3DStyle Rotation="0" />
10                                     <AxisY LineColor="64, 64, 64, 64">
11                                         <LabelStyle Font="Trebuchet MS, 8.25pt, style=Bold" />
12                                         <MajorGrid LineColor="64, 64, 64, 64" />
13                                     </AxisY>
14                                     <AxisX LineColor="64, 64, 64, 64">
15                                         <LabelStyle Font="Trebuchet MS, 8.25pt, style=Bold" />
16                                         <MajorGrid LineColor="64, 64, 64, 64" />
17                                     </AxisX>
18                                 </asp:ChartArea>
19                             </ChartAreas>
20                         </asp:Chart>
后台(部分有注释):
 1             Chart3.BackColor = Color.Moccasin;
 2             Chart3.BackGradientStyle = GradientStyle.DiagonalRight;
 3             Chart3.BorderlineDashStyle = ChartDashStyle.Solid;
 4             Chart3.BorderlineColor = Color.Gray;
 5             Chart3.BorderSkin.SkinStyle = BorderSkinStyle.Emboss;
 6
 7             // forma the chart area
 8             Chart3.ChartAreas[0].BackColor = Color.Wheat;
 9             // add and format the title
10             Chart3.Titles.Add("标题");
11             Chart3.Titles[0].Font = new Font("Utopia", 14, FontStyle.Bold);
12
13             Chart3.Series.Add(new Series("Pie")
14             {
15                 ChartType = SeriesChartType.Pie,
16                 ShadowOffset = 2
17             });
18             Chart3.Series[0].Label = "#VALX \n\n #PERCENT{P}";//显示百分比和说明
19             Chart3.Series[0].LegendText = "#VALX";
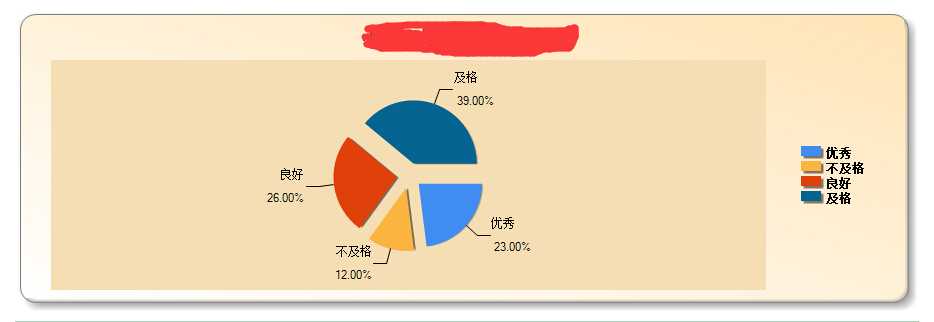
20             double[] yValues = { 23, 12, 26, 39, };
21             string[] xValues = { "优秀", "不及格", "良好", "及格" };
22             //饼状图的标签方位
23             Chart3.Series[0]["PieLabelStyle"] = "Outside";
24             Chart3.Series[0]["PieLineColor"] = "Black";
25             Chart3.Series[0].Points.DataBindXY(xValues, yValues);
26
27             //每个部分开花
28             foreach (DataPoint point in Chart3.Series[0].Points)
29             {
30                 point["Exploded"] = "true";
31             }
32             SaveChartToImg(Chart3, "4");
预览图如下:

标签:
原文地址:http://www.cnblogs.com/ogre-zl/p/5007812.html