标签:
感知机具体说明:见《统计学习方法第二章》。
实现(scikit-learn):
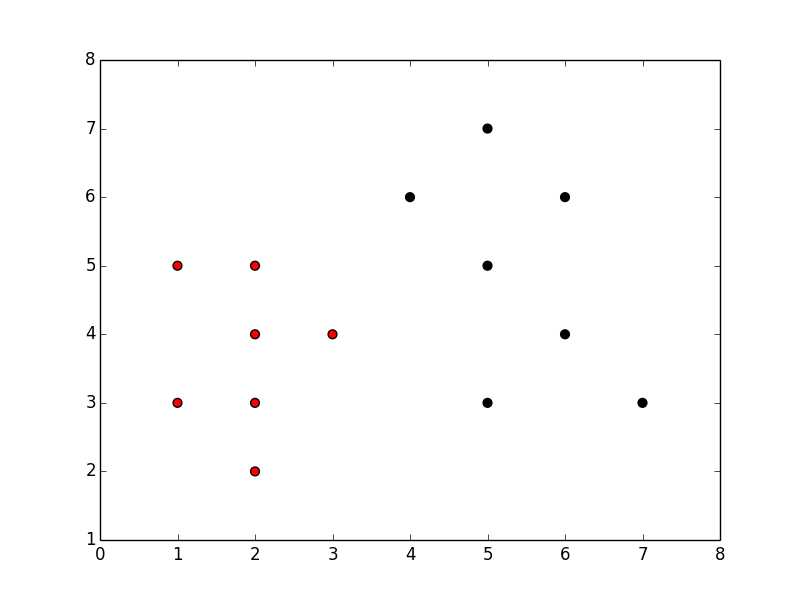
数据集
 1 import numpy as np
 2 import matplotlib.pyplot as plt
 3 from sklearn.linear_model import perceptron
 4
 5 # Data
 6 d = np.array([
 7     [2, 1, 2, 5, 7, 2, 3, 6, 1, 2, 5, 4, 6, 5],
 8     [2, 3, 3, 3, 3, 4, 4 ,4 , 5, 5, 5, 6, 6, 7]
 9     ])
10
11 # Labels
12 t = np.array([0, 0, 0, 1, 1, 0, 0, 1, 0, 0, 1, 1, 1, 1])
13
14 # plot the data
15 colormap = np.array([‘r‘, ‘k‘])
16 plt.scatter(d[0], d[1], c = colormap[t], s = 40)
17 plt.show()
数据集表示:

处理数据用坐标表示:
1 # rotate the data 180 degrees
2 d90 = np.rot90(d)
3 d90 = np.rot90(d90)
4 d90 = np.rot90(d90)
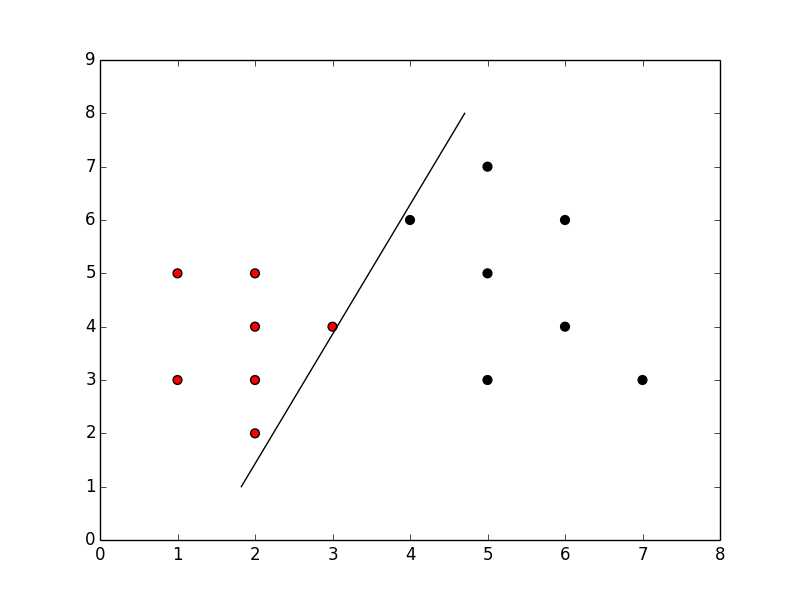
1 # # create the model
2 net = perceptron.Perceptron(n_iter = 100, verbose = 0, random_state = None, fit_intercept = True, eta0 = 0.002)
3 net.fit(d90, t)
4
5 # # print the results
6 print "Prediction" + str(net.predict(d90))
7 print "Actual    " + str(t)
8 print "Accuracy  " + str(net.score(d90, t) * 100) + "%"

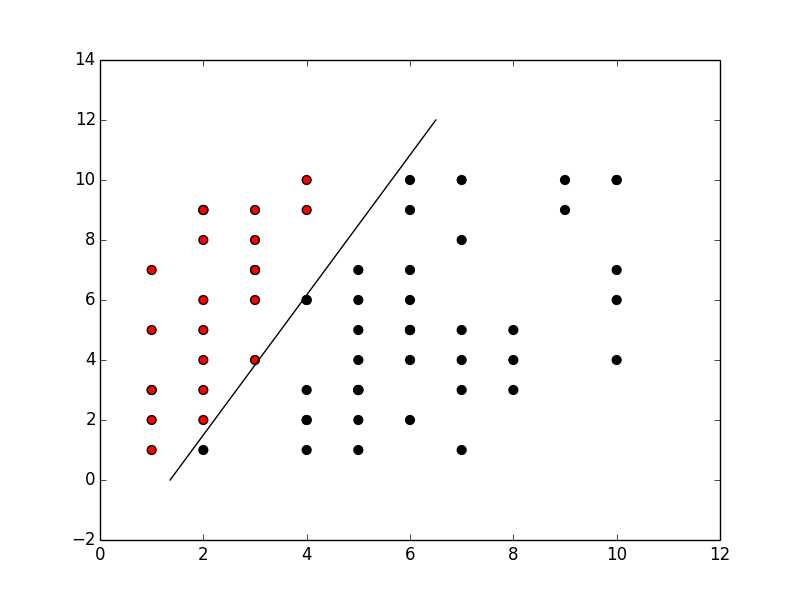
测试模型:
 1 nX = np.random.random_integers(10, size=(2, 50))
 2
 3 # Rotate it the same as the previous data
 4 nX90 = np.rot90(nX)
 5 nX90 = np.rot90(nX90)
 6 nX90 = np.rot90(nX90)
 7
 8 # # set predication as the predication results
 9 predication = net.predict(nX90)
10
11 # # Print to have a look
12 print predication
13 plt.scatter(nX[0], nX[1], c = colormap[predication], s = 40)
14
15 # now plot the hyperplane
16 ymin, ymax = plt.ylim()
17 # # cal
18 w = net.coef_[0]
19 a = -w[0] / w[1]
20 xx = np.linspace(ymin, ymax)
21 yy = a * xx - (net.intercept_[0])/ w[1]
22 plt.plot(yy, xx, ‘k-‘)
23 plt.show()

[Machine Learning]感知机(Perceptron)
标签:
原文地址:http://www.cnblogs.com/skycore/p/5096145.html