标签:
启动时间用同一台设备,同一个包进行启动时间的测试,其中三组样本数据(每组100份对比数据)如下:
base_list_1 = [0.944, 0.901, 0.957, 0.911, 1.189, 0.93, 0.94, 0.932, 0.951, 0.911, 0.934, 0.903, 0.922, 0.917, 0.931, 0.962, 0.945, 1.254, 0.918, 0.913, 0.931, 0.935, 0.89, 0.948, 0.932, 0.931, 0.875, 0.96, 1.117, 0.905, 0.955, 0.914, 0.95, 0.933, 0.941, 0.905, 0.919, 1.124, 0.953, 0.918, 0.942, 0.918, 0.914, 0.907, 0.942, 0.907, 0.895, 0.917, 0.927, 0.908, 0.915, 0.914, 0.945, 0.933, 0.894, 0.958, 0.885, 0.971, 0.94, 1.261, 0.949, 0.922, 1.009, 0.941, 0.942, 0.907, 0.913, 0.874, 0.963, 0.951, 0.972, 0.94, 0.952, 0.941, 0.954, 0.914, 0.951, 0.899, 0.908, 0.945, 0.934, 0.922, 0.92, 0.959, 0.946, 0.892, 0.847, 0.96, 0.973, 0.928, 0.913, 0.935, 0.939, 0.967, 0.907, 0.94, 0.927, 0.88, 1.004, 0.986]

cmp_list_1 = [0.931, 0.947, 0.965, 0.912, 0.966, 0.974, 0.97, 0.971, 0.958, 0.938, 0.949, 0.972, 0.946, 0.915, 0.906, 0.926, 0.955, 0.93, 0.931, 0.979, 0.952, 1.062, 0.921, 1.002, 0.927, 0.942, 0.991, 0.898, 1.121, 1.006, 0.941, 0.953, 1.013, 0.979, 0.997, 0.961, 0.947, 0.96, 0.966, 0.917, 1.002, 0.955, 0.946, 0.99, 0.945, 0.911, 0.923, 0.94, 0.933, 0.954, 0.907, 0.961, 0.937, 0.941, 0.897, 0.954, 0.979, 0.927, 0.957, 0.944, 0.961, 0.924, 0.953, 0.954, 0.929, 0.926, 0.965, 0.95, 0.964, 0.895, 0.921, 0.945, 0.955, 0.96, 0.962, 0.907, 0.933, 0.955, 0.921, 0.959, 0.934, 0.973, 0.977, 0.938, 0.945, 0.949, 0.932, 0.976, 0.947, 0.941, 0.898, 0.942, 0.887, 0.963, 0.931, 0.999, 0.915, 0.947, 0.958, 0.988]
base_list_2 = [0.887, 0.926, 0.931, 0.918, 0.905, 0.896, 0.889, 0.922, 0.923, 0.919, 0.927, 0.904, 0.927, 1.039, 0.933, 1.209, 0.935, 0.882, 0.947, 0.914, 0.871, 0.924, 0.922, 0.943, 0.902, 0.938, 0.896, 0.906, 0.939, 0.899, 0.934, 0.923, 0.927, 0.911, 0.943, 0.886, 0.844, 0.913, 0.907, 0.954, 0.934, 0.854, 0.953, 0.903, 0.931, 0.838, 0.936, 0.955, 0.943, 0.933, 0.901, 1.18, 0.907, 0.883, 0.885, 0.909, 0.94, 0.939, 0.889, 0.917, 0.933, 0.904, 0.888, 0.953, 0.936, 0.947, 0.927, 0.881, 0.914, 0.937, 0.898, 0.914, 0.929, 0.945, 0.935, 0.902, 0.939, 0.925, 0.909, 0.903, 0.92, 0.917, 0.987, 0.911, 0.889, 0.888, 0.91, 0.941, 0.904, 0.911, 0.908, 0.793, 1.113, 0.947, 0.876, 0.908, 0.91, 0.921, 0.941, 0.987]

cmp_list_1 = [0.929, 0.94, 0.931, 0.978, 0.965, 0.938, 0.941, 0.937, 0.91, 0.92, 0.934, 0.92, 0.981, 0.939, 0.928, 0.95, 0.94, 0.928, 0.925, 0.933, 0.963, 0.954, 0.987, 0.965, 0.96, 0.94, 0.966, 0.96, 0.942, 0.969, 0.978, 0.964, 0.921, 0.964, 0.939, 0.97, 0.961, 0.945, 1.004, 0.951, 0.916, 0.942, 0.955, 0.975, 0.947, 0.917, 0.944, 0.943, 0.905, 0.955, 0.96, 0.994, 0.925, 0.922, 0.958, 0.957, 0.958, 0.907, 0.981, 0.937, 0.959, 0.919, 0.959, 0.932, 0.951, 0.927, 0.949, 0.949, 0.944, 0.913, 0.967, 0.981, 0.942, 0.949, 0.932, 0.933, 0.97, 0.931, 0.918, 0.972, 0.95, 0.962, 0.988, 1.0, 1.003, 0.949, 0.933, 0.955, 0.934, 0.952, 0.937, 0.977, 0.936, 0.991, 0.986, 0.943, 0.997, 0.975, 0.991, 0.984]
base_list_1 = [1.359, 1.415, 1.395, 1.318, 1.345, 1.417, 1.36, 1.373, 1.337, 1.332, 1.498, 1.318, 1.392, 1.364, 1.397, 1.793, 1.341, 1.364, 1.428, 1.345, 1.418, 1.364, 1.372, 1.541, 1.465, 1.373, 1.337, 1.52, 1.375, 1.367, 1.366, 1.347, 1.334, 1.422, 1.354, 1.369, 1.413, 1.345, 1.373, 1.363, 1.464, 1.344, 1.324, 1.331, 1.405, 1.355, 1.674, 1.38, 1.352, 1.339, 1.326, 1.362, 1.431, 1.774, 1.312, 1.292, 1.384, 1.473, 1.337, 1.406, 1.412, 1.385, 1.292, 1.384, 1.342, 1.333, 1.435, 1.372, 1.42, 1.315, 1.344, 1.414, 1.51, 1.334, 1.308, 1.468, 1.401, 1.316, 1.373, 1.407, 1.474, 1.382, 1.346, 1.373, 1.366, 1.378, 1.315, 1.417, 1.431, 1.379, 1.324, 1.383, 1.349, 1.4, 1.327, 1.734, 1.395, 1.412, 1.438, 1.384]

cmp_list_1 = [1.414, 1.326, 1.421, 1.371, 1.363, 1.36, 1.417, 1.34, 1.357, 1.429, 1.308, 1.324, 1.351, 1.323, 1.367, 1.412, 1.391, 1.661, 1.34, 1.38, 1.528, 1.417, 1.352, 1.569, 1.32, 1.473, 1.531, 1.445, 1.407, 1.529, 1.356, 1.349, 1.362, 1.358, 1.375, 1.365, 1.317, 1.302, 1.342, 1.351, 1.393, 1.473, 1.392, 1.299, 1.367, 1.381, 1.354, 1.374, 1.551, 1.448, 1.387, 1.361, 1.358, 1.362, 1.568, 1.343, 1.334, 1.378, 1.417, 1.382, 1.421, 1.345, 1.336, 1.302, 1.349, 1.381, 1.374, 1.359, 1.38, 1.553, 1.34, 1.269, 1.353, 1.329, 1.649, 1.392, 1.367, 1.377, 1.403, 1.361, 1.352, 1.466, 1.389, 1.346, 1.345, 1.35, 1.383, 1.446, 1.613, 1.395, 1.402, 1.394, 1.348, 1.353, 1.395, 1.345, 1.274, 1.425, 1.351, 1.586]
进行正态性检验的目的是为了验证我们的测试数据样本是不是符合正态分布(近似),而且下面的统计学利用是需要在正态分布下进行的,因此,进行正态性检验是必备的。下列图对应的是区域内的频数统计
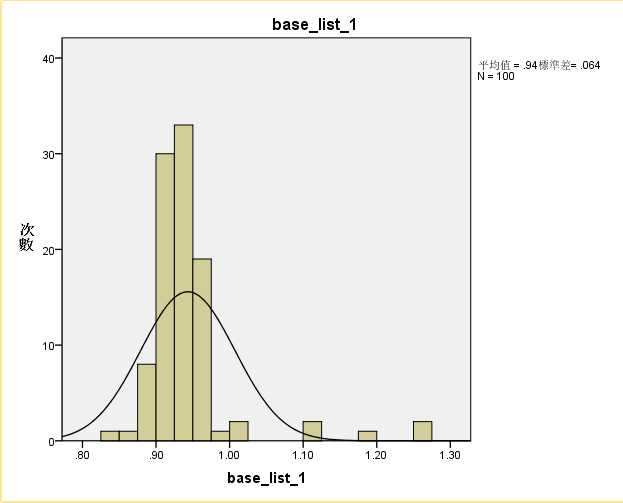
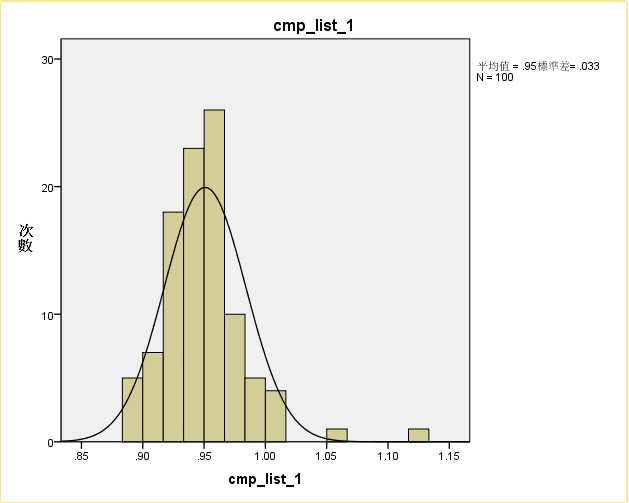
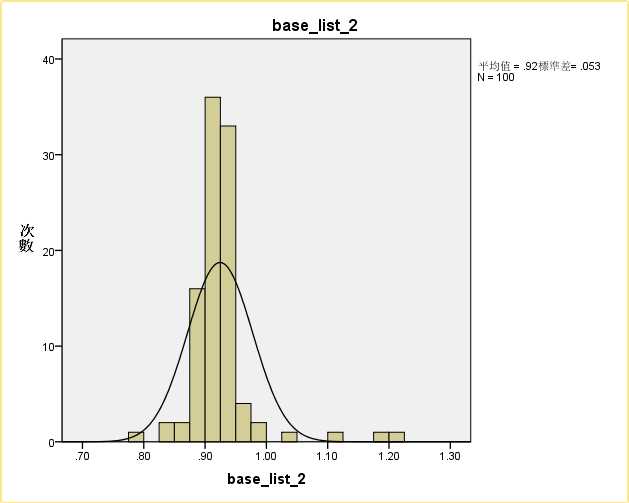
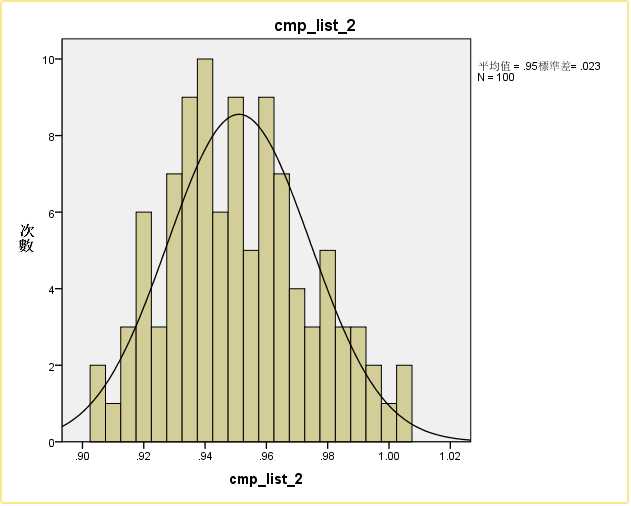
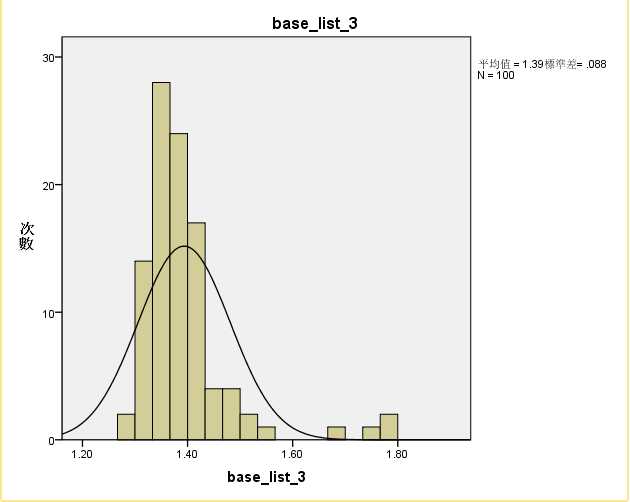
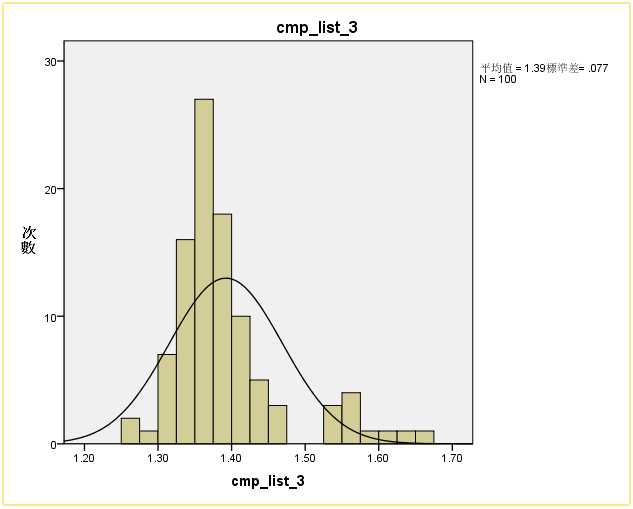
因为是同一台设备的同一个场景,因此可知左右两边的分布应该是近似一致的。通过观察Q-Q图与Q-Q去势图可以断定,我们的启动时间是符合正态分布的。但需要注意的是,base_list_2跟cmp_list_2的分布,方差明显差很多,可以看出数据分布更加零散(基本可以断定第二组数据是不能拿来作为对比的),而其他几组几乎是同形状的分布。
方差齐性检验的目的是为了检验两组数据两两对比的差异,从而判断两组数据的数据来源分布是否一致。能否通过方差齐性检验,是我们能否采用这组数据作为对比数据的前提标准。
判断脚本如下
#coding:utf-8
import MySQLdb
import json
import numpy as np
from scipy.stats import levene
import threading

import matplotlib.pyplot as plt
import matplotlib.mlab as mlab

class DBOperate(object):
    def __init__(self, host, user, db, passwd, port):
        self.host = host
        self.user = user
        self.db = db
        self.passwd = passwd
        self.port = port
        self.conn = MySQLdb.connect(
            host = self.host,
            user = self.user,
            passwd = self.passwd,
            db = self.db,
            port = self.port)
        self.cur = self.conn.cursor()

    def execute(self,sql):
        try:
            self.cur.execute(sql)
            self.conn.commit()
            print "======sql执行成功: ",sql
        except Exception as e:
            print e

    def getData(self,sql):
        try:
            self.cur.execute(sql)
            result = self.cur.fetchall()
            return result
        except Exception as e:
            print e

    def close(self):
        self.cur.close()
        self.conn.close()

class MathTools(object):
    def __init__(self,base_data,cmp_data):
        self.base_data = base_data
        self.cmp_data = cmp_data

    def testVar(self):
        ‘‘‘方差齐性检验
        ‘‘‘
        result = levene(self.base_data,self.cmp_data)
        print result
        if float(result[1]) > 0.05:
            print "方差齐性检验通过,可以认为方差相等(说明硬件或者执行时间不同可能带来的误差可以忽略)!"

    def getMeanAndVar(self):
        ‘‘‘获取样本均值跟方差
        ‘‘‘
        for each in [self.base_data,self.cmp_data]:
            mean = np.mean(each)
            var = np.var(each)
            std = np.std(each)
            print "==================="
            print "均值:",mean
            print "方差:",var
            print "标准差:",std
            print "==================="
        return mean,var,std


def drawPlot(avg,std):
    x = np.linspace(0.5,1.5,10000)
    plt.plot(x,mlab.normpdf(x,avg,std))
    plt.show()

def dataAnalysis(tuple_data):
    avg_list = []
    for each_tuple in tuple_data:
        str_data = each_tuple[0]
        dic_data = json.loads(str_data)
        avg_time = float(dic_data[‘intervalStartTime‘])
        avg_list.append(avg_time)
    return avg_list

def outputData(dboperate,task_id_1,task_id_2):
    data_base = dboperate.getData(‘‘‘SELECT start_time_log from uctc_qms_start_time WHERE task_id=%s‘‘‘%task_id_1)
    data_cmp = dboperate.getData(‘‘‘SELECT start_time_log from uctc_qms_start_time WHERE task_id=%s‘‘‘%task_id_2)
    base_list = dataAnalysis(data_base)
    cmp_list = dataAnalysis(data_cmp)
    return base_list,cmp_list


def main():
    dboperate = DBOperate(
        host="xxxx",
        user="xxxx",
        passwd="xxxx",
        db="xxxx",
        port=3306)
    base_list_1,cmp_list_1 = outputData(dboperate,216674,216675)
    print "base_list_1:\n",base_list_1
    print "cmp_list_1:\n",cmp_list_1
    mt = MathTools(base_list_1,cmp_list_1)
    mt.testVar()
    avg_list = mt.getMeanAndVar()
    base_list_2,cmp_list_2 = outputData(dboperate,216679,216680)
    print "base_list_2:\n",base_list_2
    print "cmp_list_2:\n",cmp_list_2
    mt2 = MathTools(base_list_2,cmp_list_2)
    mt2.testVar()
    mt2.getMeanAndVar()

    base_list_3,cmp_list_3 = outputData(dboperate,216677,216682)
    print "base_list_1:\n",base_list_3
    print "cmp_list_1:\n",cmp_list_3
    mt3 = MathTools(base_list_3,cmp_list_3)
    mt3.testVar()
    mt3.getMeanAndVar()

    dboperate.close()


if __name__ == ‘__main__‘:
    main()
分别对三组数据做方差齐性检验发现第二组数据没有通过方差齐性检验,第二组数据中base_list_2跟cmp_list_2存在显著性差异,由于我们的测试是用了同一设备的同一个包进行同一种测试,因此可以断定第二组数据必须过滤掉。
base_list_1:
[0.944, 0.901, 0.957, 0.911, 1.189, 0.93, 0.94, 0.932, 0.951, 0.911, 0.934, 0.903, 0.922, 0.917, 0.931, 0.962, 0.945, 1.254, 0.918, 0.913, 0.931, 0.935, 0.89, 0.948, 0.932, 0.931, 0.875, 0.96, 1.117, 0.905, 0.955, 0.914, 0.95, 0.933, 0.941, 0.905, 0.919, 1.124, 0.953, 0.918, 0.942, 0.918, 0.914, 0.907, 0.942, 0.907, 0.895, 0.917, 0.927, 0.908, 0.915, 0.914, 0.945, 0.933, 0.894, 0.958, 0.885, 0.971, 0.94, 1.261, 0.949, 0.922, 1.009, 0.941, 0.942, 0.907, 0.913, 0.874, 0.963, 0.951, 0.972, 0.94, 0.952, 0.941, 0.954, 0.914, 0.951, 0.899, 0.908, 0.945, 0.934, 0.922, 0.92, 0.959, 0.946, 0.892, 0.847, 0.96, 0.973, 0.928, 0.913, 0.935, 0.939, 0.967, 0.907, 0.94, 0.927, 0.88, 1.004, 0.986]
cmp_list_1:
[0.931, 0.947, 0.965, 0.912, 0.966, 0.974, 0.97, 0.971, 0.958, 0.938, 0.949, 0.972, 0.946, 0.915, 0.906, 0.926, 0.955, 0.93, 0.931, 0.979, 0.952, 1.062, 0.921, 1.002, 0.927, 0.942, 0.991, 0.898, 1.121, 1.006, 0.941, 0.953, 1.013, 0.979, 0.997, 0.961, 0.947, 0.96, 0.966, 0.917, 1.002, 0.955, 0.946, 0.99, 0.945, 0.911, 0.923, 0.94, 0.933, 0.954, 0.907, 0.961, 0.937, 0.941, 0.897, 0.954, 0.979, 0.927, 0.957, 0.944, 0.961, 0.924, 0.953, 0.954, 0.929, 0.926, 0.965, 0.95, 0.964, 0.895, 0.921, 0.945, 0.955, 0.96, 0.962, 0.907, 0.933, 0.955, 0.921, 0.959, 0.934, 0.973, 0.977, 0.938, 0.945, 0.949, 0.932, 0.976, 0.947, 0.941, 0.898, 0.942, 0.887, 0.963, 0.931, 0.999, 0.915, 0.947, 0.958, 0.988]
(2.585452271112739, 0.10944298973519527)
方差齐性检验通过,可以认为方差相等(说明硬件或者执行时间不同可能带来的误差可以忽略)!
===================
均值: 0.9432
方差: 0.00405766
标准差: 0.0636997645208
===================
===================
均值: 0.95079
方差: 0.0011006859
标准差: 0.0331765866237
===================
base_list_2:
[0.887, 0.926, 0.931, 0.918, 0.905, 0.896, 0.889, 0.922, 0.923, 0.919, 0.927, 0.904, 0.927, 1.039, 0.933, 1.209, 0.935, 0.882, 0.947, 0.914, 0.871, 0.924, 0.922, 0.943, 0.902, 0.938, 0.896, 0.906, 0.939, 0.899, 0.934, 0.923, 0.927, 0.911, 0.943, 0.886, 0.844, 0.913, 0.907, 0.954, 0.934, 0.854, 0.953, 0.903, 0.931, 0.838, 0.936, 0.955, 0.943, 0.933, 0.901, 1.18, 0.907, 0.883, 0.885, 0.909, 0.94, 0.939, 0.889, 0.917, 0.933, 0.904, 0.888, 0.953, 0.936, 0.947, 0.927, 0.881, 0.914, 0.937, 0.898, 0.914, 0.929, 0.945, 0.935, 0.902, 0.939, 0.925, 0.909, 0.903, 0.92, 0.917, 0.987, 0.911, 0.889, 0.888, 0.91, 0.941, 0.904, 0.911, 0.908, 0.793, 1.113, 0.947, 0.876, 0.908, 0.91, 0.921, 0.941, 0.987]
cmp_list_2:
[0.929, 0.94, 0.931, 0.978, 0.965, 0.938, 0.941, 0.937, 0.91, 0.92, 0.934, 0.92, 0.981, 0.939, 0.928, 0.95, 0.94, 0.928, 0.925, 0.933, 0.963, 0.954, 0.987, 0.965, 0.96, 0.94, 0.966, 0.96, 0.942, 0.969, 0.978, 0.964, 0.921, 0.964, 0.939, 0.97, 0.961, 0.945, 1.004, 0.951, 0.916, 0.942, 0.955, 0.975, 0.947, 0.917, 0.944, 0.943, 0.905, 0.955, 0.96, 0.994, 0.925, 0.922, 0.958, 0.957, 0.958, 0.907, 0.981, 0.937, 0.959, 0.919, 0.959, 0.932, 0.951, 0.927, 0.949, 0.949, 0.944, 0.913, 0.967, 0.981, 0.942, 0.949, 0.932, 0.933, 0.97, 0.931, 0.918, 0.972, 0.95, 0.962, 0.988, 1.0, 1.003, 0.949, 0.933, 0.955, 0.934, 0.952, 0.937, 0.977, 0.936, 0.991, 0.986, 0.943, 0.997, 0.975, 0.991, 0.984]
(4.5987224867656273, 0.0332145312054625)
===================
均值: 0.92446
方差: 0.0028034084
标准差: 0.0529472227789
===================
===================
均值: 0.95108
方差: 0.0005381736
标准差: 0.0231985689214

===================
base_list_3:
[1.359, 1.415, 1.395, 1.318, 1.345, 1.417, 1.36, 1.373, 1.337, 1.332, 1.498, 1.318, 1.392, 1.364, 1.397, 1.793, 1.341, 1.364, 1.428, 1.345, 1.418, 1.364, 1.372, 1.541, 1.465, 1.373, 1.337, 1.52, 1.375, 1.367, 1.366, 1.347, 1.334, 1.422, 1.354, 1.369, 1.413, 1.345, 1.373, 1.363, 1.464, 1.344, 1.324, 1.331, 1.405, 1.355, 1.674, 1.38, 1.352, 1.339, 1.326, 1.362, 1.431, 1.774, 1.312, 1.292, 1.384, 1.473, 1.337, 1.406, 1.412, 1.385, 1.292, 1.384, 1.342, 1.333, 1.435, 1.372, 1.42, 1.315, 1.344, 1.414, 1.51, 1.334, 1.308, 1.468, 1.401, 1.316, 1.373, 1.407, 1.474, 1.382, 1.346, 1.373, 1.366, 1.378, 1.315, 1.417, 1.431, 1.379, 1.324, 1.383, 1.349, 1.4, 1.327, 1.734, 1.395, 1.412, 1.438, 1.384]
cmp_list_3:
[1.414, 1.326, 1.421, 1.371, 1.363, 1.36, 1.417, 1.34, 1.357, 1.429, 1.308, 1.324, 1.351, 1.323, 1.367, 1.412, 1.391, 1.661, 1.34, 1.38, 1.528, 1.417, 1.352, 1.569, 1.32, 1.473, 1.531, 1.445, 1.407, 1.529, 1.356, 1.349, 1.362, 1.358, 1.375, 1.365, 1.317, 1.302, 1.342, 1.351, 1.393, 1.473, 1.392, 1.299, 1.367, 1.381, 1.354, 1.374, 1.551, 1.448, 1.387, 1.361, 1.358, 1.362, 1.568, 1.343, 1.334, 1.378, 1.417, 1.382, 1.421, 1.345, 1.336, 1.302, 1.349, 1.381, 1.374, 1.359, 1.38, 1.553, 1.34, 1.269, 1.353, 1.329, 1.649, 1.392, 1.367, 1.377, 1.403, 1.361, 1.352, 1.466, 1.389, 1.346, 1.345, 1.35, 1.383, 1.446, 1.613, 1.395, 1.402, 1.394, 1.348, 1.353, 1.395, 1.345, 1.274, 1.425, 1.351, 1.586]
(0.0077692351582683648, 0.92985189389348166)
方差齐性检验通过,可以认为方差相等(说明硬件或者执行时间不同可能带来的误差可以忽略)!
===================
均值: 1.39346
方差: 0.0075982484
标准差: 0.0871679321769
===================
===================
均值: 1.39223
方差: 0.0058431971
标准差: 0.0764408078189
===================
如果均值的误差重叠,则认为软件迭代对性能没有影响。显著性检验是为了检查两组样本有没有显著性差异,通过校验可以说明这两组数据的可信度。
其实T检验更适合服从正态分布的小样本判断,大样本应采用z检验。但由于我对小样本跟大样本都有对应测试,得到了同样的结论(ps:具体t值不同),故这里暂时先用原来的大样本来处理。
显著性检验脚本:
#!/usr/bin/python
import string
import math
import sys

from scipy.stats import  t
import matplotlib.pyplot as plt
import numpy as np

##############
# Parameters #
##############
ver = 1
verbose = 0
alpha = 0.05

def usage():
    print """
    usage: ./program data_file(one sample in one line)
    """

def main():

    sample1 = [1.15, 1.119, 1.098, 1.147, 1.092, 1.131, 1.17, 1.138, 1.115, 1.143, 1.126, 1.182, 1.124, 1.145, 1.093, 1.131, 1.102, 1.191, 1.093, 1.089, 1.115, 1.128, 1.119, 1.163, 1.143, 1.114, 1.098, 1.142, 1.126, 1.213, 1.279, 1.125, 1.174, 1.103, 1.13, 1.089, 1.164, 1.106, 1.155, 1.085, 1.186, 1.155, 1.207, 1.081, 1.122, 1.112, 1.137, 1.096, 1.078, 1.122, 1.11, 1.095, 1.132, 1.134, 1.118, 1.117, 1.116, 1.116, 1.108, 1.14, 1.099, 1.124, 1.113, 1.203, 1.135, 1.124, 1.098, 1.105, 1.082, 1.107, 1.155, 1.164, 1.096, 1.175, 1.17, 1.161, 1.093, 1.152, 1.085, 0.969, 1.068, 0.95, 1.077, 0.999, 1.147, 1.144, 1.097, 1.119, 1.126, 1.148, 1.083, 1.106, 1.107, 1.094, 1.121, 1.136, 1.086, 1.141, 1.119, 1.153]
    sample2 = [1.154, 1.094, 1.131, 1.087, 1.148, 1.046, 1.228, 1.142, 0.931, 1.063, 1.12, 1.08, 1.129, 1.073, 1.116, 1.081, 1.177, 1.081, 1.133, 1.093, 1.13, 1.085, 1.125, 1.062, 1.133, 1.062, 0.927, 1.055, 1.202, 1.162, 1.102, 1.098, 1.126, 1.144, 1.088, 1.131, 1.105, 1.094, 1.099, 1.112, 1.158, 1.181, 1.107, 0.937, 1.082, 1.1, 1.06, 1.114, 1.088, 1.141, 1.085, 1.232, 1.131, 1.155, 1.069, 1.149, 1.088, 1.125, 1.074, 1.13, 1.053, 1.102, 1.128, 1.166, 1.101, 1.192, 1.073, 1.131, 1.057, 1.098, 1.077, 1.119, 1.084, 1.164, 1.114, 1.148, 1.063, 1.113, 1.084, 1.063, 1.05, 1.078, 1.112, 1.181, 1.109, 1.087, 1.075, 1.078, 1.109, 1.081, 1.104, 1.059, 1.099, 1.142, 1.084, 1.084, 1.09, 1.089, 1.14, 1.105]

    sample_len = len(sample1)
    sample_diff = []

    for i in range(sample_len):
        sample_diff.append(sample1[i] - sample2[i])

    if (verbose):
        print("sample_diff = ", sample_diff)


    ######################
    # Hypothesis testing #
    ######################
    sample = sample_diff

    numargs = t.numargs
    [ df ] = [sample_len - 1,] * numargs
    if (verbose):
        print("df(degree of freedom, student‘s t distribution parameter) = ", df)

    sample_mean = np.mean(sample)
    sample_std = np.std(sample, dtype=np.float64, ddof=1)
    if (verbose):
        print("mean = %f, std = %f" % (sample_mean, sample_std))

    abs_t = math.fabs( sample_mean / (sample_std / math.sqrt(sample_len)) )
    if (verbose):
        print("t = ", abs_t)

    t_alpha_percentile = t.ppf(1 - alpha / 2, df)

    if (verbose):
        print("abs_t = ", abs_t)
        print("t_alpha_percentile = ", t_alpha_percentile)

    if (abs_t >= t_alpha_percentile):
        print "REJECT the null hypothesis"
    else:
        print "ACCEPT the null hypothesis"

    ########
    # Plot #
    ########
    rv = t(df)
    limit = np.minimum(rv.dist.b, 5)
    x = np.linspace(-1 * limit, limit)
    h = plt.plot(x, rv.pdf(x))
    plt.xlabel(‘x‘)
    plt.ylabel(‘t(x)‘)
    plt.title(‘Difference significance test‘)
    plt.grid(True)
    plt.axvline(x = t_alpha_percentile, ymin = 0, ymax = 0.095,
            linewidth=2, color=‘r‘)
    plt.axvline(x = abs_t, ymin = 0, ymax = 0.6,
            linewidth=2, color=‘g‘)

    plt.annotate(r‘(1 - $\alpha$ / 2) percentile‘, xy = (t_alpha_percentile, 0.05),
            xytext=(t_alpha_percentile + 0.5, 0.09), arrowprops=dict(facecolor = ‘black‘, shrink = 0.05),)
    plt.annotate(‘t value‘, xy = (abs_t, 0.26),
            xytext=(abs_t + 0.5, 0.30), arrowprops=dict(facecolor = ‘black‘, shrink = 0.05),)

    leg = plt.legend((‘Student\‘s t distribution‘, r‘(1 - $\alpha$ / 2) percentile‘, ‘t value‘),
            ‘upper left‘, shadow = True)
    frame = leg.get_frame()
    frame.set_facecolor(‘0.80‘)
    for i in leg.get_texts():
        i.set_fontsize(‘small‘)

    for l in leg.get_lines():
        l.set_linewidth(1.5)

    normalized_sample = [0] * sample_len
    for i in range(0, sample_len):
        normalized_sample[i] = (sample[i] - sample_mean) / (sample_std / math.sqrt(sample_len))
    plt.plot(normalized_sample, [0] * len(normalized_sample), ‘ro‘)
    plt.show()

if __name__ == "__main__":
    main()
轮流替换sample里的值。为了保证结果是可行的,先用numpy生成了两组服从标准正态分布的测试数据来说明。
检验结果如下:
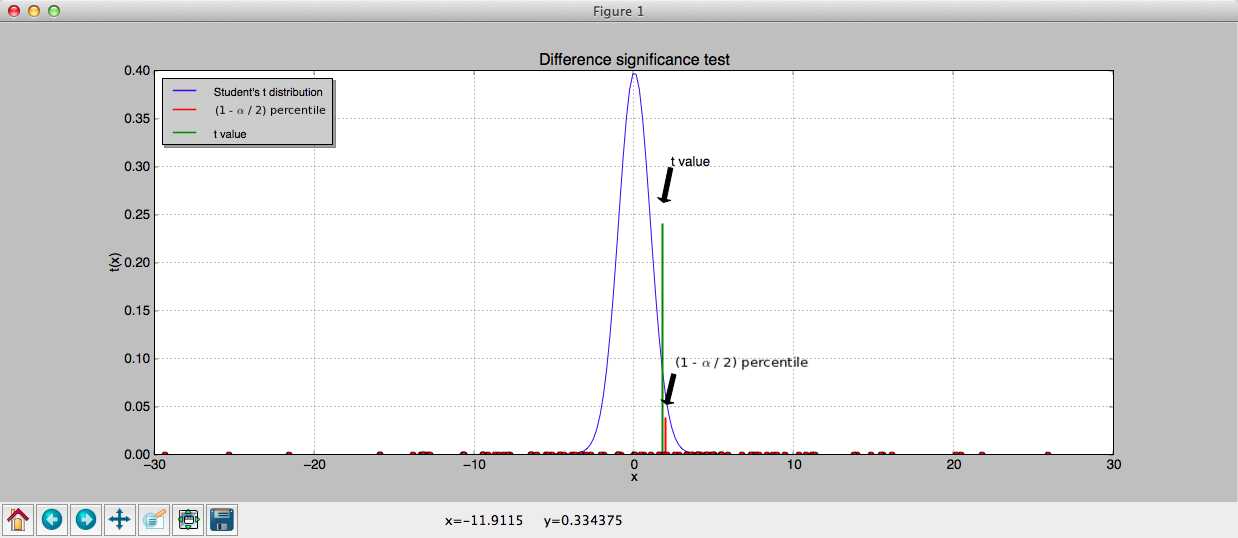
输出为:ACCEPT the null hypothesis。
意思是这两组数据没有显著性差异(均值)
另外对我们云测设备的数据进行测试。
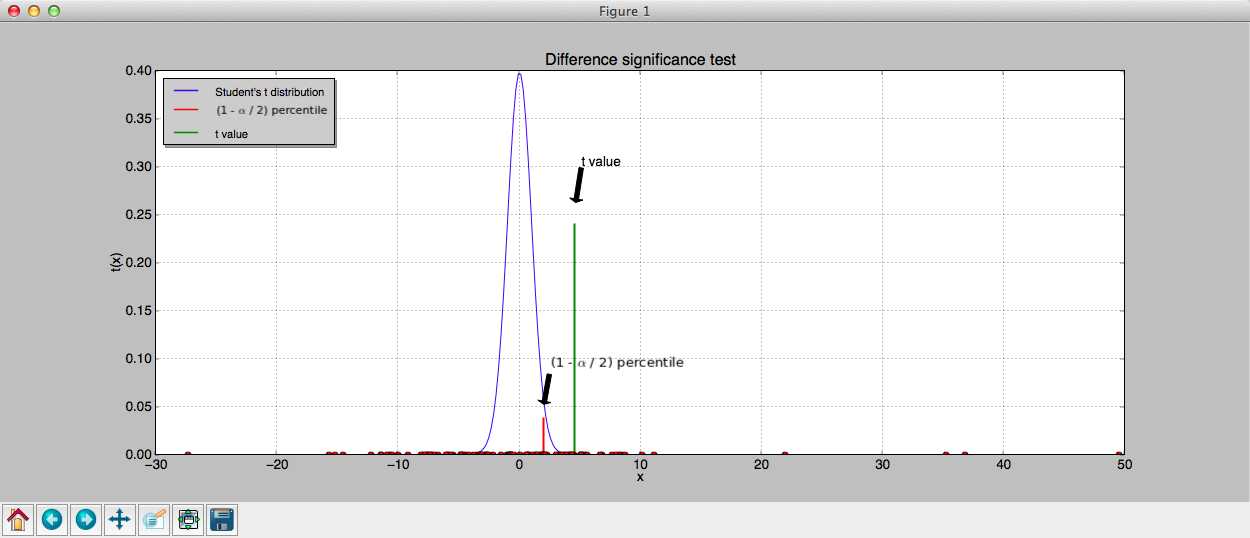
输出:REJECT the null hypothesis(代表我们数据存在显著性差异)
2.第二组测试:
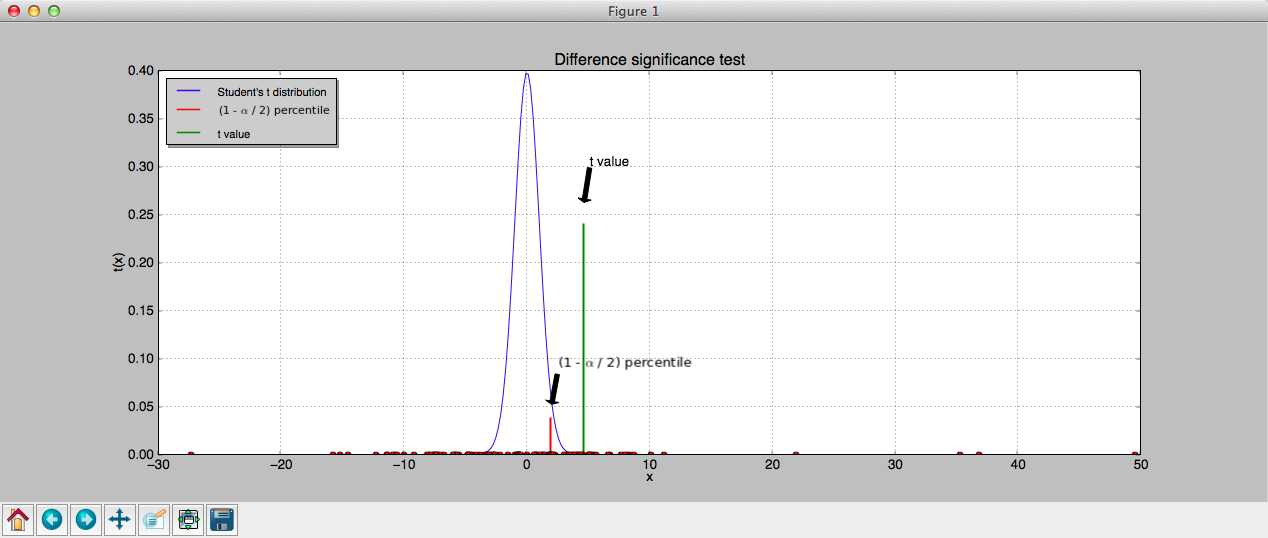
输出:REJECT the null hypothesis(代表我们数据存在显著性差异)
3.第三组测试:
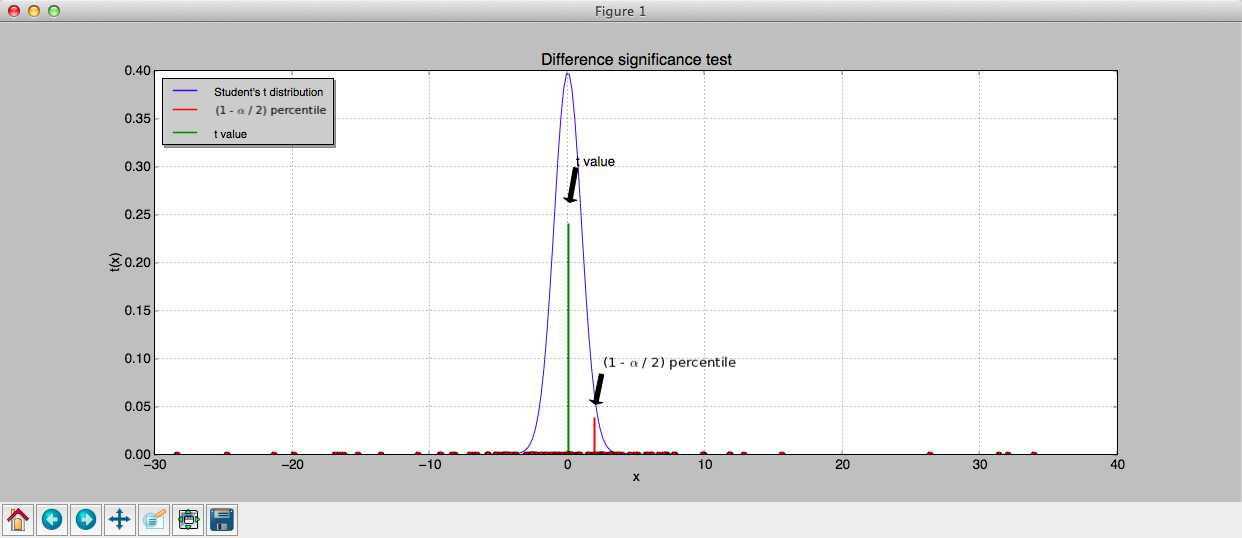
1.通过正态性检验-方差齐性检验-t检验后,真正能用的数据就只剩下第三组。
base_list_3:
[1.359, 1.415, 1.395, 1.318, 1.345, 1.417, 1.36, 1.373, 1.337, 1.332, 1.498, 1.318, 1.392, 1.364, 1.397, 1.793, 1.341, 1.364, 1.428, 1.345, 1.418, 1.364, 1.372, 1.541, 1.465, 1.373, 1.337, 1.52, 1.375, 1.367, 1.366, 1.347, 1.334, 1.422, 1.354, 1.369, 1.413, 1.345, 1.373, 1.363, 1.464, 1.344, 1.324, 1.331, 1.405, 1.355, 1.674, 1.38, 1.352, 1.339, 1.326, 1.362, 1.431, 1.774, 1.312, 1.292, 1.384, 1.473, 1.337, 1.406, 1.412, 1.385, 1.292, 1.384, 1.342, 1.333, 1.435, 1.372, 1.42, 1.315, 1.344, 1.414, 1.51, 1.334, 1.308, 1.468, 1.401, 1.316, 1.373, 1.407, 1.474, 1.382, 1.346, 1.373, 1.366, 1.378, 1.315, 1.417, 1.431, 1.379, 1.324, 1.383, 1.349, 1.4, 1.327, 1.734, 1.395, 1.412, 1.438, 1.384]
cmp_list_3:
[1.414, 1.326, 1.421, 1.371, 1.363, 1.36, 1.417, 1.34, 1.357, 1.429, 1.308, 1.324, 1.351, 1.323, 1.367, 1.412, 1.391, 1.661, 1.34, 1.38, 1.528, 1.417, 1.352, 1.569, 1.32, 1.473, 1.531, 1.445, 1.407, 1.529, 1.356, 1.349, 1.362, 1.358, 1.375, 1.365, 1.317, 1.302, 1.342, 1.351, 1.393, 1.473, 1.392, 1.299, 1.367, 1.381, 1.354, 1.374, 1.551, 1.448, 1.387, 1.361, 1.358, 1.362, 1.568, 1.343, 1.334, 1.378, 1.417, 1.382, 1.421, 1.345, 1.336, 1.302, 1.349, 1.381, 1.374, 1.359, 1.38, 1.553, 1.34, 1.269, 1.353, 1.329, 1.649, 1.392, 1.367, 1.377, 1.403, 1.361, 1.352, 1.466, 1.389, 1.346, 1.345, 1.35, 1.383, 1.446, 1.613, 1.395, 1.402, 1.394, 1.348, 1.353, 1.395, 1.345, 1.274, 1.425, 1.351, 1.586]
(0.0077692351582683648, 0.92985189389348166)
方差齐性检验通过,可以认为方差相等(说明硬件或者执行时间不同可能带来的误差可以忽略)!
===================
均值: 1.39346
方差: 0.0075982484
标准差: 0.0871679321769
===================
===================
均值: 1.39223
方差: 0.0058431971
标准差: 0.0764408078189
===================
可以看到这两组数据的均值跟方差均比较接近,也是比较符合我们经验结果的测试数据。
2.同一个包,同一台设备的启动时间测试结论如下
(1).三组测试数据失败两组,足以说明我们的测试很不稳定。(需要找目前测试不稳定的原因,主要是目前引入的变量)
(2).两组样本通过方差齐性检验,说明我们不需要引入新的测试变量,如cpu,内存变化,以及硬件等对启动时间的影响。
(3).通过控制t分布的置信区间,可以动态调整对应的数据均值范围。
标签:
原文地址:http://www.cnblogs.com/alexkn/p/5172049.html