码迷,mamicode.com
首页 > Web开发 > 详细

Extjs 融合highcharts

时间:2016-04-07 20:20:45      阅读:271      评论:0      收藏:0      [点我收藏+]

标签:

最近看ext的东西,讲真,快把人看哭了,封装的太死,各种不灵活,写得心好累。直接贴代码吧

创建一个panel

var panel = new Ext.Panel({
            id:‘main-panel‘,
            baseCls:‘x-plain‘,
            layout:‘hbox‘,
            items:[{
                html:‘<div id="container" style="width:90%;height:90%;"></div>‘,
                afterRender: function () {
                    drawCharts();
                }}
            ]
        });

drawCharts中的方法就是普通的hightcharts渲染图表的方法

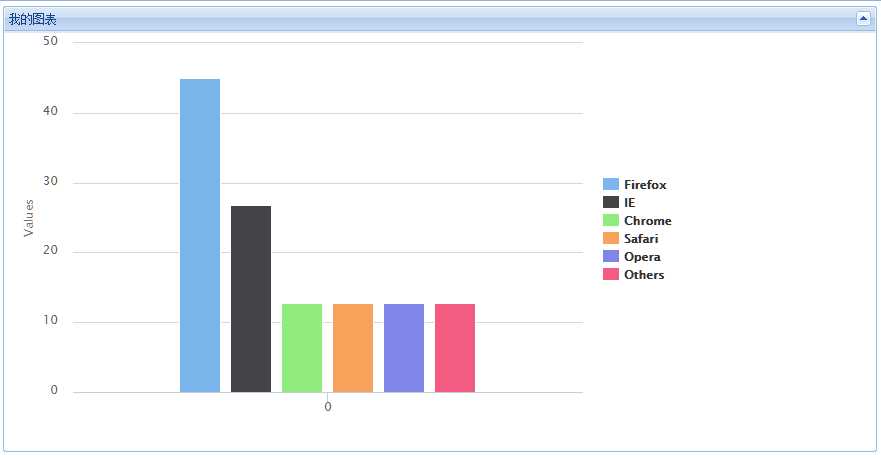
function drawCharts(){
     var options = {
                chart: {
                    plotBackgroundColor: null,
                    plotBorderWidth: null,
                    plotShadow: false,
                    renderTo:‘container‘,
                    type:‘column‘
                },
                 legend: {
                        layout: ‘vertical‘,
                        align: ‘right‘,
                        verticalAlign: ‘middle‘,
                        borderWidth: 0
                    },
                title: {
                    text: ‘‘
                },
            tooltip: {
                  pointFormat:{series.name}: <b>{point.percentage:.1f}%</b>‘
                },
                labels:{
                    items:[{
                        html:‘‘,
                        style: {
                            left:‘1px‘,
                            top:‘1px‘,                
                        }
                    }],
                    style:{
                        color:‘red‘,
                        fontSize:45,
                        fontWeight:‘bold‘,
                        zIndex:1000
                    }
                },
                series:  [{
                name: ‘Browser share‘,
                data: [
                    [‘Firefox‘,   45.0],
                    [‘IE‘,       26.8],
                    {
                        name: ‘Chrome‘,
                        y: 12.8,
                        sliced: true,
                        selected: true
                    },
                    [‘Safari‘,    8.5],
                    [‘Opera‘,     6.2],
                    [‘Others‘,   0.7]
                ]
            }]
            };
        
            new Highcharts.Chart(options);
}

最后效果如下

技术分享


Extjs 融合highcharts

标签:

原文地址:http://www.cnblogs.com/-totoro/p/5365052.html

(0)
(0)
   
举报
评论 一句话评论(0
登录后才能评论!
© 2014 mamicode.com 版权所有  联系我们:gaon5@hotmail.com
迷上了代码!