标签:
先来张效果图:
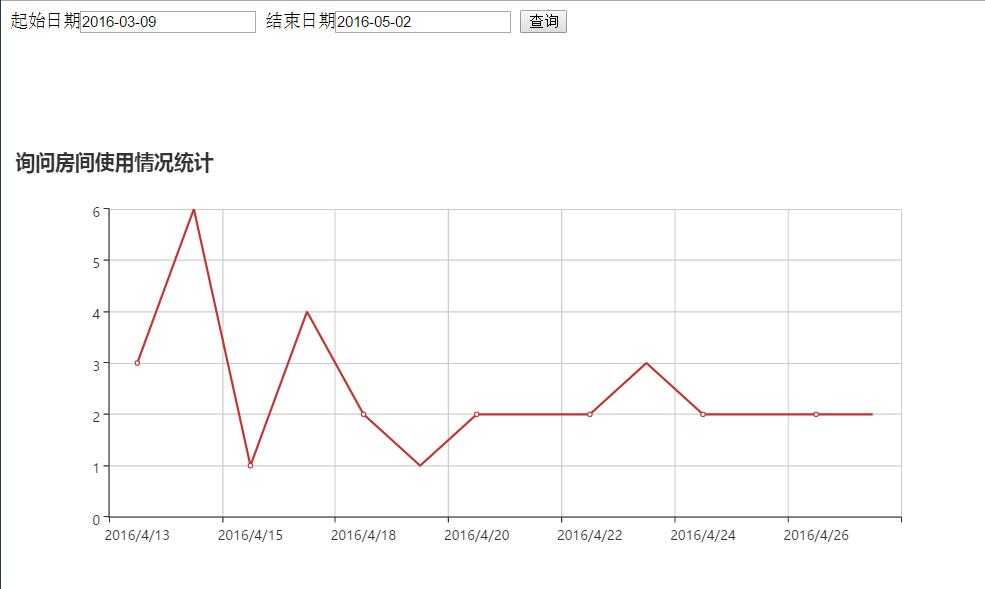
View部分:
@{
    ViewBag.Title = "Home Page";
    Layout = null;
    string date1 = "";
    string date2 = "";
    if (ViewBag.date1!=null)
    {
        date1 = ViewBag.date1;
    }
    if (ViewBag.date2 != null)
    {
        date2 = ViewBag.date2;
    }
}

<link href="~/Content/jquery-ui.css" rel="stylesheet" />
<script src="~/Scripts/jquery-1.10.2.min.js"></script>
<script src="~/Scripts/jquery-ui.js"></script>
<script src="~/Scripts/jquery.ui.datepicker-zh-CN.js"></script>
@*<script src="~/Scripts/jquery.easyui.min.js"></script>*@
<script src="~/Scripts/echarts.min.js"></script>
<script>
    $(function() {
        $("#startdate").datepicker();
        $("#enddate").datepicker();
    });
</script>


<div>
    <form method="post" action="/Home/Index">
        <label>起始日期</label><input name="startdate" id="startdate" value="@date1">
        <label>结束日期</label><input name="enddate" id="enddate" value="@date2">
        <input type="submit" value="查询">
    </form>
</div>

<div id="main" style="width: 900px;height:400px;margin-top:100px">
</div>
<script type="text/javascript">

    // 基于准备好的dom,初始化echarts实例


    var myChart = echarts.init(document.getElementById(‘main‘));

    var option = {
        title: {
            text: ‘询问房间使用情况统计‘
        },
        tooltip: {},
        legend: {
            data: [‘使用次数‘]
        },
        xAxis: {
            data:@MvcHtmlString.Create(ViewBag.dateList),
        },
        yAxis: {},
        series: [{
            name: ‘次数‘,
            type: ‘line‘,
            data: @ViewBag.countList,
        }]
    };


    myChart.setOption(option);


</script>
Controller部分:
using System;
using System.Collections.Generic;
using System.Linq;
using System.Web;
using System.Web.Mvc;
using Echarts动态数据.ADO;
using Newtonsoft.Json;
namespace Echarts动态数据.Controllers
{
    public class HomeController : Controller
    {
        ProcuracyRoom_testEntities db;

        public ActionResult Index()
        {
            return View();
        }
        [HttpPost]
        [ActionName("Index")]
        public ActionResult IndexPost()
        {
            string date1 = Request.Form["startdate"];
            ViewBag.date1 = date1;//开始时间
            string date2 = Request.Form["enddate"];
            ViewBag.date2 = date2;//结束时间
            DateTime startdate = Convert.ToDateTime(date1);
            DateTime enddate = Convert.ToDateTime(date2).AddDays(1);
            db = new ProcuracyRoom_testEntities();

            var q = from t in db.RoomApplication
                    where t.UseDate >= startdate && t.UseDate < enddate && t.State > 0
                    group t by t.UseDate into g
                    select new { date = g.Key, count = g.Count() };
            var list = q.ToList();
            string[] dateList = (from t in list select t.date.ToShortDateString()).ToArray();
            string s = JsonConvert.SerializeObject(dateList);
            ViewBag.dateList = s;
            int[] countList = (from t in list select t.count).ToArray();
            string s1 = JsonConvert.SerializeObject(countList);
            ViewBag.countList = s1;
            return View("Index");


        }

}
}
标签:
原文地址:http://www.cnblogs.com/DotaSteam/p/5468507.html