标签:
Debugging JS program is not as easy as we do in Visual Studio or any other IDE. I usually us "alert()" function to add some breakpoints for debugging.
For example:
 var costAdjust = $(e.container).find("input[name=‘CostAdjustment‘]").data("kendoNumericTextBox");
 costAdjust.value(Number($("#extraMinTotal").html()) * Number($("#extraMinRate").html()));
 costAdjust.trigger("change", { value:costAdjust.value() });
If the costAdjust didn‘t trigger like I expect. I will add a alert try to check if the #extraMinRate got the right value.
 var costAdjust = $(e.container).find("input[name=‘CostAdjustment‘]").data("kendoNumericTextBox");
 alert($("#extraMinRate").html());
 costAdjust.value(Number($("#extraMinTotal").html()) * Number($("#extraMinRate").html()));
 costAdjust.trigger("change", { value:costAdjust.value() });
But in this way it will stop your page coding flow and it can‘t show all the detail if you try to see object‘s value. Like this:
 var costAdjust = $(e.container).find("input[name=‘CostAdjustment‘]").data("kendoNumericTextBox");
 alert($("#extraMinRate"));
 costAdjust.value(Number($("#extraMinTotal").html()) * Number($("#extraMinRate").html()));
 costAdjust.trigger("change", { value:costAdjust.value() });
This time alert will only showing "Object" without any detail:
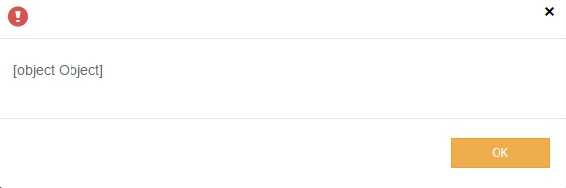
The better way to show the object detail is using "console.log()" instead of alert.
 var costAdjust = $(e.container).find("input[name=‘CostAdjustment‘]").data("kendoNumericTextBox");
 console.log($("#extraMinRate"));
 costAdjust.value(Number($("#extraMinTotal").html()) * Number($("#extraMinRate").html()));
 costAdjust.trigger("change", { value:costAdjust.value() });
You should check your output using chrome browser inspect function (Ctrl + Shift + I). At he Console tab, you will see the object detail.
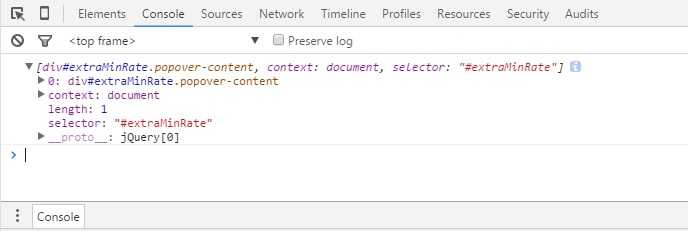
You can click the little trianggle to find more details of this object. That allows you to trace your code data easierly and your page flow will not be stoped.
<END>
The Better Way to Debug Your JavaScript Program
标签:
原文地址:http://www.cnblogs.com/ivyfu/p/5551755.html