标签:
import struct
import sqlalchemy
import pandas
import matplotlib.pyplot as Plot
from matplotlib.finance import candlestick_ohlc as Drawk

Engine = sqlalchemy.create_engine(‘mssql+pyodbc://sa:123456@XiTongDSN‘)
Dataframe = pandas.read_sql(‘sh‘, Engine)

I = list(Dataframe[‘date‘].index)
O = Dataframe[‘open‘]
H = Dataframe[‘high‘]
L = Dataframe[‘low‘]
C = Dataframe[‘close‘]
V = Dataframe[‘volume‘]
Quotes = []
for i in range(0, len(I)):
    Quotes.append((I[i], O[i], H[i], L[i], C[i], V[i]))

figure = Plot.figure(‘Made by DengChaohai‘)

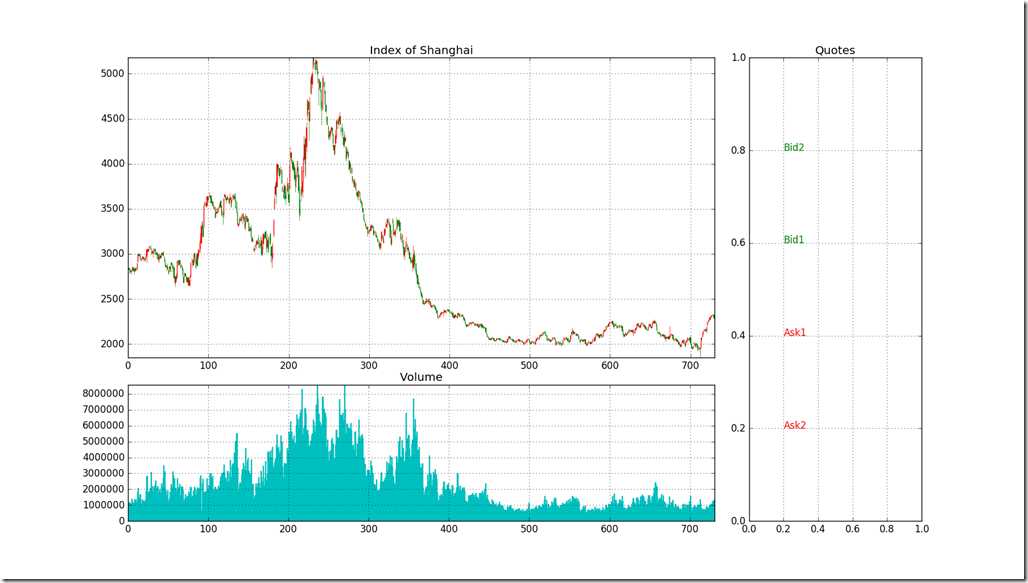
f1 = figure.add_subplot(3, 4, (1, 7), title = ‘Index of Shanghai‘)
Drawk(f1, Quotes, colorup=‘g‘, colordown=‘r‘)
Plot.grid(True)
Plot.axis(‘tight‘)

f2 = figure.add_subplot(1, 4, 4, title = ‘Quotes‘)
f2.text(0.2, 0.8, ‘Bid2‘, color = ‘g‘)
f2.text(0.2, 0.6, ‘Bid1‘, color = ‘g‘)
f2.text(0.2, 0.4, ‘Ask1‘, color = ‘r‘)
f2.text(0.2, 0.2, ‘Ask2‘, color = ‘r‘)
Plot.grid(True)

f3 = figure.add_subplot(3, 4, (9, 11), title = ‘Volume‘)
f3.bar(I, V, color = ‘c‘, edgecolor = ‘c‘)
Plot.grid(True)
Plot.axis(‘tight‘)
Plot.show()

标签:
原文地址:http://www.cnblogs.com/blog-3123958139/p/5554179.html