标签:
The way your web content behaves on mobile can be dramatically different from the desktop experience. Remote debugging with Chrome DevTools lets you
debug live content on your Android device from your development machine.
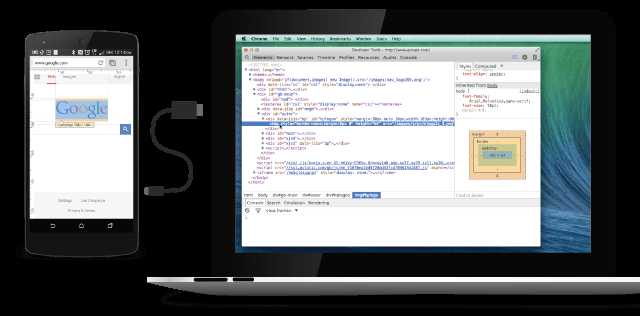
Remote debugging on Android supports:
To begin remote debugging, you need:
Note: Remote debugging requires your version of desktop Chrome to be newer than the version of Chrome for Android on your device.
For best results, use Chrome Canary(Mac/Windows) or the Chrome Dev channel release (Linux) on desktop.
If at any time you encounter problems with remote debugging, refer to the Troubleshooting section.
Follow these instructions to set up your Android device for remote debugging.
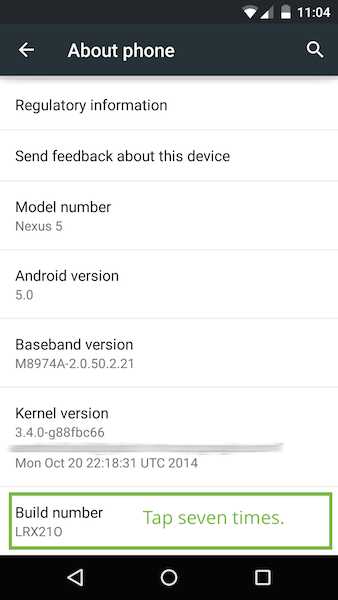
On your Android device, select Settings > Developer options.
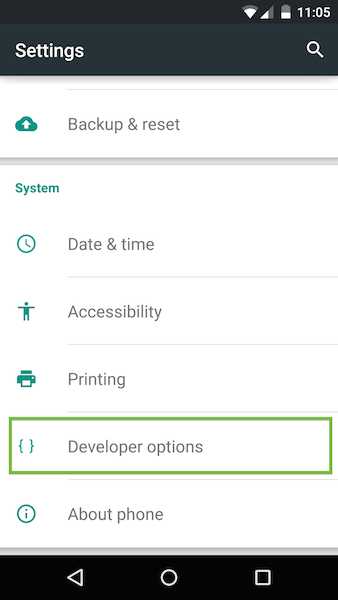
Developer options on the Settings page.
In Developer options, select the USB debugging checkbox:
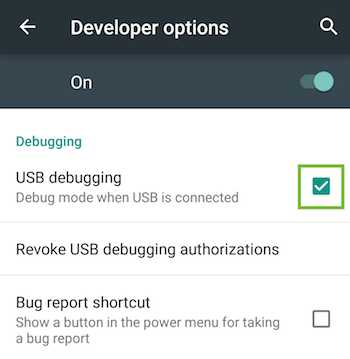
Enabling USB debugging on Android.
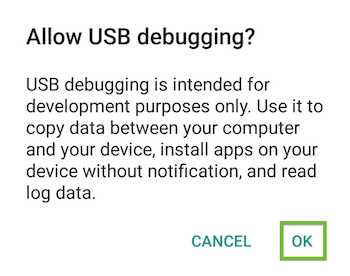
An alert prompts you to allow USB debugging. Tap OK.
Connect the Android device to your development machine using a USB cable.
Note: If you are developing on Windows, install the appropriate USB driver for your device.
See OEM USB Drivers on the Android Developers‘ site.
After setting up remote debugging on Android, discover your device in Chrome.
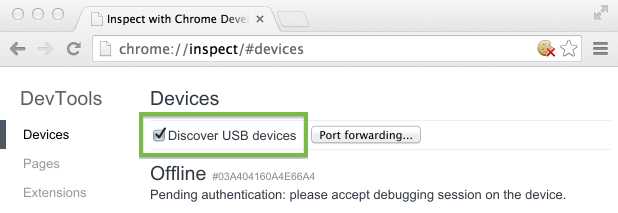
On your desktop Chrome browser, navigate to chrome://inspect. Confirm that Discover USB devices is checked:
Tip: You can also get to chrome://inspect by selecting Chrome menu > More tools > Inspect Devices.
On your device, an alert prompts you to allow USB debugging from your computer. Tap OK.
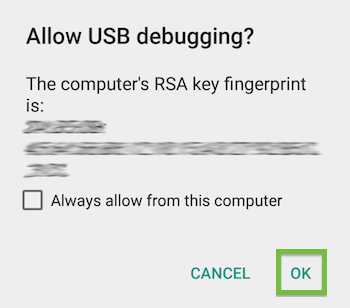
Tip: To skip this alert in the future, check Always allow from this computer.
The message USB debugging connected displays in the device‘s notification drawer.
Note: During remote debugging, Chrome prevents your device’s screen from going to sleep. This feature is useful for debugging, but is also less secure.
So be sure to keep an eye on your device!
On your computer, the chrome://inspect page displays every connected device, along with its open tabs and debug-enabled WebViews.
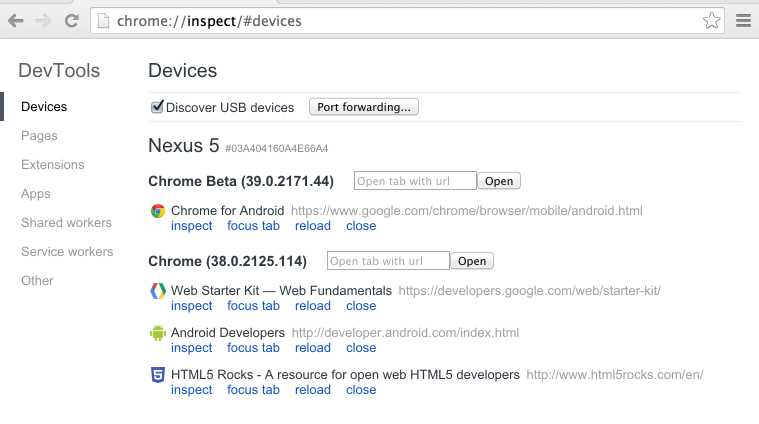
Viewing connected devices from the chrome://inspect page.
If you have problems finding your device on the chrome://inspect page, see the Troubleshooting section.
From the chrome://inspect page, you can launch DevTools and debug your remote browser tabs.
To start debugging, click inspect below the browser tab you want to debug.
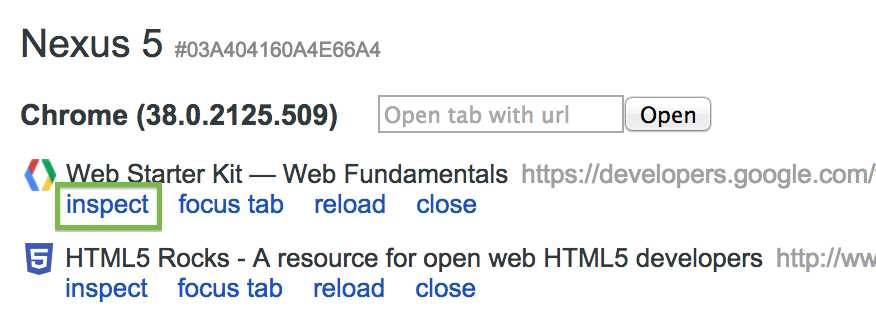
A new instance of Chrome DevTools launches on your computer. From this instance, you can interact with the selected browser tab on your device in real time.
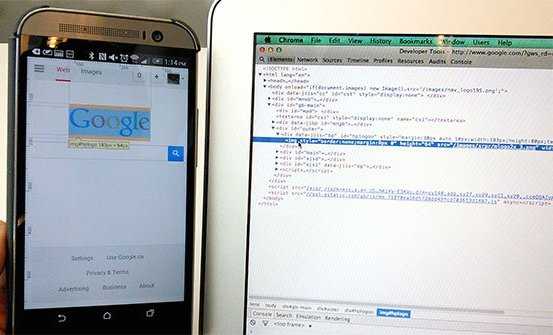
Debug a web page on your Android phone from your laptop using Chrome DevTools.
For example, you can use DevTools to inspect web page elements on your device:
 icon in DevTools and tap your device screen. DevTools highlights the tapped element in the Elements panel.
Note: The version of Chrome on your device determines the version of DevTools used during remote debugging. For this reason,
the remote debugging DevTools might differ from the version that you normally use.
Here are a few tips to help get you started with remote debugging:
On Android 4.4 (KitKat) or later, you can use DevTools to debug WebView content in native Android applications.
WebView debugging must be enabled from within your application. To enable WebView debugging, call the static method setWebContentsDebuggingEnabled
on the WebView class.
  if (Build.VERSION.SDK_INT >= Build.VERSION_CODES.KITKAT) {
      WebView.setWebContentsDebuggingEnabled(true);
  }
This setting applies to all of the application‘s WebViews.
Tip: WebView debugging is not affected by the state of the debuggable flag in the application‘s manifest. If you want to enable WebView debugging only when debuggable is true,
test the flag at runtime.
  if (Build.VERSION.SDK_INT >= Build.VERSION_CODES.KITKAT) {
    if (0 != (getApplicationInfo().flags &= ApplicationInfo.FLAG_DEBUGGABLE))
    { WebView.setWebContentsDebuggingEnabled(true); }
  }
The chrome://inspect page displays a list of debug-enabled WebViews on your device.
To start debugging, click inspect below the WebView you want to debug. Use DevTools as you would for a remote browser tab.
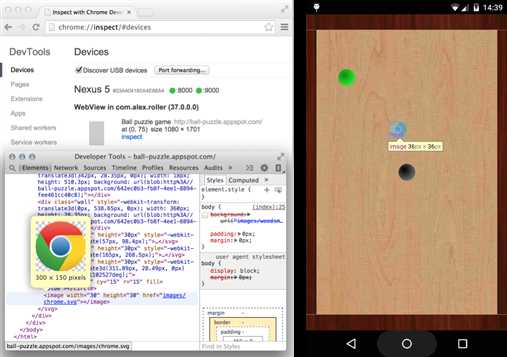
Debugging a remote Android WebView with the Chrome DevTools.
The gray graphics listed with the WebView represent its size and position relative to the device‘s screen. If your WebViews have titles set, the titles are listed as well.
Shifting your attention between screens isn’t always convenient. Screencast displays your device‘s screen right alongside DevTools on your development machine. You can interact with the content on your device from the screencast too.
As of KitKat 4.4.3, screencast is available for both browser tabs and Android WebViews.
To start screencasting, click the Screencast  icon in the upper right corner of your remote debugging DevTools window.

The Screencast icon.
The Screencast panel opens on the left and displays a live view of your device‘s screen.
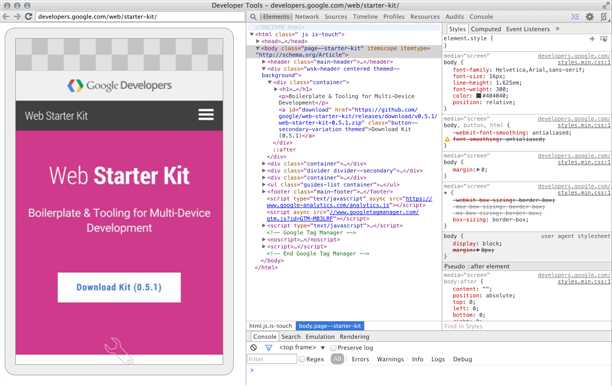
Live interactive screencast from your Android to your laptop.
Screencast only displays page content. Transparent portions of the screencast are covered by the omnibox, device keyboard, and other device interfaces.
Note: Because screencast continuously captures frames, it has some performance overhead. If your tests are sensitive to frame rate, disable screencast.
When you interact with the screencast, clicks are translated into taps, firing proper touch events on the device. Keystrokes from your computer are sent to the device, so you can avoid typing with your thumbs.
Other DevTools work with the screencast too. For example, to inspect an element, click the Inspect Element  icon and then click inside the screencast.
Tips: To simulate a pinch gesture, hold Shift while dragging. To scroll, use your trackpad or mouse wheel or fling with your pointer.
Your phone can‘t always reach the content on your development server. They might be on different networks. Moreover, you might be developing on a restricted corporate network.
Port forwarding on Chrome for Android makes it easy to test your development site on mobile. It works by creating a listening TCP port on your mobile device that maps to a particular TCP port on your development machine. Traffic between these ports travels through USB, so the connection doesn‘t depend on your network configuration.
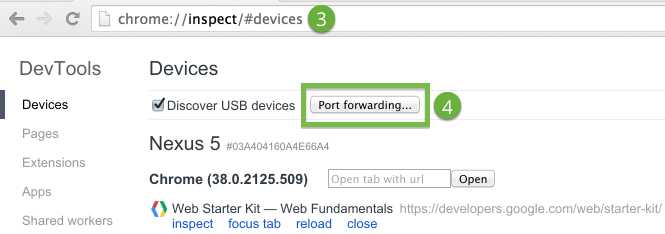
To enable port forwarding:

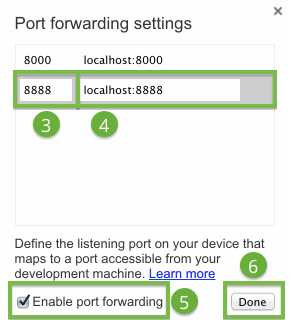 The port forwarding settings.
The port status indicators on chrome://inspect are green when port forwarding is successful.
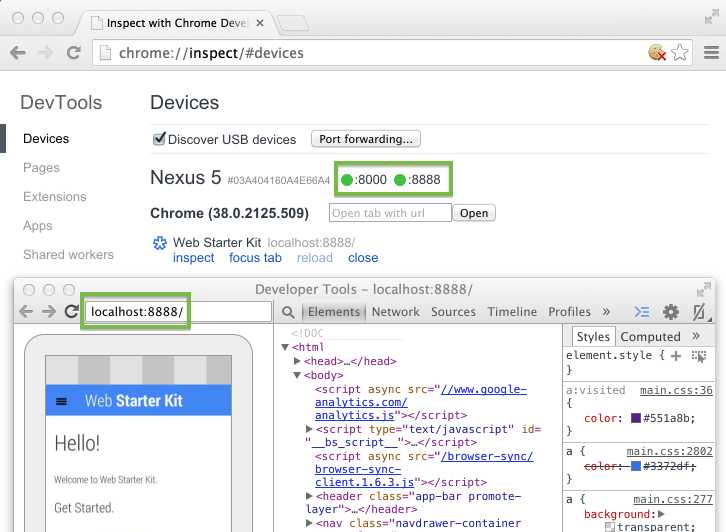
Viewing the content of your local web server on Android using port forwarding.
Now you can open a new Chrome for Android tab and view the content of your local server on your device.
Port forwarding works great when you‘re developing on localhost. But there are cases when you might be using a customized local domain.
For example, suppose you‘re using a third party JavaScript SDK that only works on whitelisted domains. So you added an entry, such as 127.0.0.1 production.com, to your hosts file. Or maybe you configured a customized domain using virtual hosts on your web server (MAMP).
If you want your phone to reach content on your customized domain, you can use port forwarding in combination with a proxy server. The proxy maps requests from your device to the correct location on the host machine.
Virtual host mapping requires you to run a proxy server on the host machine. All requests from your Android device will be forwarded to the proxy.
To set up port forwarding to a proxy:
Note: The proxy server and your development server must be running on different ports.
9000.localhost:xxxx, where xxxx is the port your proxy is running on.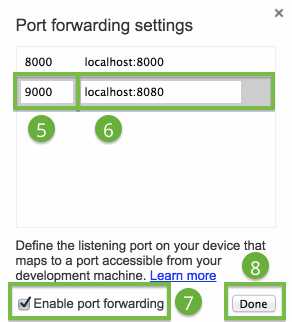 Port forwarding to a proxy.
The proxy on the host machine is set up to make requests on behalf of your Android device.
Your Android device needs to communicate with the proxy on the host machine.
To configure the proxy settings on your device:
Note: Proxy settings apply per network.
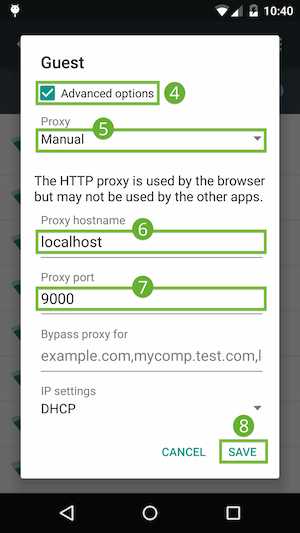 Proxy settings on the device.
localhost.9000.With these settings, your device forwards all of its requests to the proxy on the host machine. The proxy makes requests on behalf of your device, so requests to your customized local domain are properly resolved.
Now you can load local domains on Chrome for Android just as you would on the host machine.
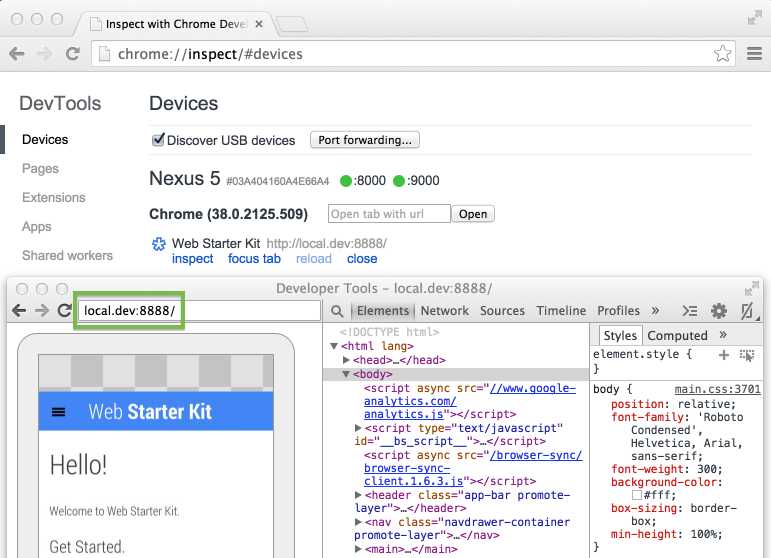
Using virtual host mapping to access a customized local domain from an Android device.
Tip: To resume normal browsing, remember to revert the proxy settings on your device after you disconnect from the host.
If you still can‘t see your device, unplug it. On your device, select Settings > Developer options. Tap Revoke USB debugging authorizations. Then, retry the device setup and discovery processes.
Lastly, if remote debugging still isn‘t working, you can revert to the legacy workflow using the adb binary from the Android SDK.
You no longer need to configure ADB or the ADB plugin to debug remote browser tabs and WebViews. Remote debugging for Android is now part of the standard Chrome DevTools. It works on all operating systems: Windows, Mac, Linux, and Chrome OS.
If you do encounter problems with remote debugging, you can try the legacy workflow using the adb binary from the Android SDK.
Note: The direct USB connection between Chrome and the device might interrupt your adbconnection. Before establishing your adb connection, uncheck Discover USB devices onchrome://inspect. Then, disconnect and reconnect the device.
For information about the remote debugging interaction protocol, refer to the Debugger Protocol documentation andchrome.debugger.
Content available under the CC-By 3.0 license
通过Chrome浏览器进行android调试/Remote Debugging on Android with Chrome
标签:
原文地址:http://www.cnblogs.com/liaojie970/p/5656142.html