标签:
前言:
最近想看看矢量中值滤波(Vector median filter, VMF)在GRB图像上的滤波效果,意外的是找了一大圈却发现网上没有现成的code,所以通过matab亲自实现了一个,需要学习的朋友可以拿过去用。本文的核心是VMF的matlab实现,最后通过在RGB图像上应用举例说明。
VMF的数学表达:
含有N个矢量的集合{C1,C2,...CN},它的VMF结果如下所示:
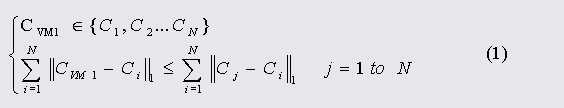
其中,CVM1表示距离所有其他向量的距离和最小的那个向量。而距离可以自己定义,常用的欧氏距离,曼哈顿距离等等。
matlab code:
%   向量中值滤波,根据欧式距离进行滤波,将RGB图像中每个像素位置的三个颜色作为一个向量整体处理。

% pdist函数解释
% Pairwise distance between pairs of objects
% Syntax
% D = pdist(X)
% D = pdist(X,distance)
% Description
%
% D = pdist(X)
% 计算 X 中各对行向量的相互距离(X是一个m-by-n的矩阵). 这里 D 要特别注意,
% D 是一个长为m(m–1)/2的行向量.可以这样理解 D 的生成:首先生成一个 X 的距离方阵,
% 由于该方阵是对称的,且对角线上的元素为0,所以取此方阵的下三角元素,按照Matlab中矩阵的按列存储原则,
% 此下三角各元素的索引排列即为(2,1), (3,1), ..., (m,1), (3,2), ..., (m,2), ..., (m,m–1).
% 可以用命令 squareform(D) 将此行向量转换为原距离方阵.(squareform函数是专门干这事的,其逆变换是也是squareform。)
%
% D = pdist(X,distance) 使用指定的距离.

vectors_set = rand(5,3);%向量集合中的每一行是一个向量,一共含有5个向量

dist = pdist(vectors_set,‘euclidean‘);%使用欧式距离计算向量之间的距离
dist = squareform(dist);%还原回矩阵的形式
dist = sum(dist,2);%求出每个向量到其他所有向量的距离和
indx = find(dist==min(dist));%找到距离和最小的向量的index
median_vec = vectors_set(indx,:) %根据index找出中值向量
RGB图像上的应用:
%   向量中值滤波,根据欧式距离进行滤波,可以用于RGB图像的去噪。

clc;    % Clear command window.
clear;    % Delete all variables.
close all;    % Close all figure windows except those created by imtool.
imtool close all;    % Close all figure windows created by imtool.
workspace;    % Make sure the workspace panel is showing.
fontSize = 15;
% Read in a standard MATLAB color demo image.
folder = fullfile(matlabroot, ‘\toolbox\images\imdemos‘);
baseFileName = ‘peppers.png‘;
% Get the full filename, with path prepended.
fullFileName = fullfile(folder, baseFileName);
if ~exist(fullFileName, ‘file‘)
    % Didn‘t find it there.  Check the search path for it.
    fullFileName = baseFileName; % No path this time.
    if ~exist(fullFileName, ‘file‘)
        % Still didn‘t find it.  Alert user.
        errorMessage = sprintf(‘Error: %s does not exist.‘, fullFileName);
        uiwait(warndlg(errorMessage));
        return;
    end
end
rgbImage = imread(fullFileName);
subplot(1, 3, 1);
imshow(rgbImage);
title(‘Original color Image‘, ‘FontSize‘, fontSize);
subplot(1, 3, 2);
noisyRGB = imnoise(rgbImage,‘salt & pepper‘, 0.05);
imshow(noisyRGB);
title(‘Image with Salt and Pepper Noise‘, ‘FontSize‘, fontSize);
subplot(1, 3, 3);
resortedImage = noisyRGB;

[h,w,bands] = size(rgbImage);%彩色图像的大小
win_radius = 1;%滤波窗口半径大小
win_size = (2*win_radius+1).^2;%滤波窗口的大小
for i = 1 + win_radius : h - 2
    for j = 1 + win_radius : w-2
        vectors_set = reshape(rgbImage(i-win_radius:i+win_radius,j-win_radius:j+win_radius,:),win_size,1,bands);%将窗口内的向量进行变形
        vectors_set = reshape(permute(vectors_set,[2,3,1]),bands,[])‘;%将向量矩阵变为每一行为一个向量的模式
        [n,d] = size(vectors_set);%n是向量个数,d是向量维度
        % pdist
        % Pairwise distance between pairs of objects
        % Syntax
        % D = pdist(X)
        % D = pdist(X,distance)
        % Description
        %
        % D = pdist(X)
        % 计算 X 中各对行向量的相互距离(X是一个m-by-n的矩阵). 这里 D 要特别注意,
        % D 是一个长为m(m–1)/2的行向量.可以这样理解 D 的生成:首先生成一个 X 的距离方阵,
        % 由于该方阵是对称的,且对角线上的元素为0,所以取此方阵的下三角元素,按照Matlab中矩阵的按列存储原则,
        % 此下三角各元素的索引排列即为(2,1), (3,1), ..., (m,1), (3,2), ..., (m,2), ..., (m,m–1).
        % 可以用命令 squareform(D) 将此行向量转换为原距离方阵.(squareform函数是专门干这事的,其逆变换是也是squareform。)
        %
        % D = pdist(X,distance) 使用指定的距离.distance可以取下面圆括号中的值,用红色标出!
        dist = pdist(vectors_set,‘euclidean‘);
        dist = squareform(dist);
        dist = sum(dist,2);
        indx = find(dist==min(dist));
        median_vec = vectors_set(indx,:);
        resortedImage(i,j,:)= median_vec(1,:);
    end
end

imshow(resortedImage);
title(‘Restored Image‘, ‘FontSize‘, fontSize);
实验结果:
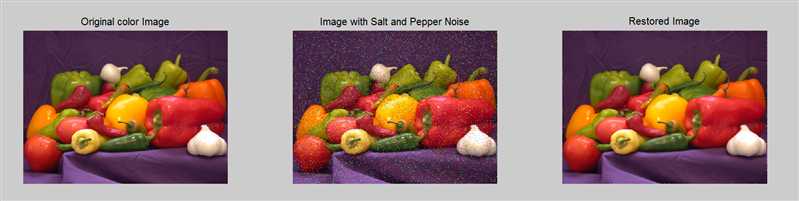
总结:算法的实现并不复杂,但是运算时间较长,可以进一步优化。
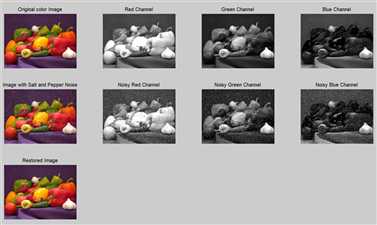
另外:在针对RGB图像的矢量滤波上面,有一种做法是color plane by color plane的做法,虽然已经不算是vector median filter-based的方法了,但是效果还好,可以借鉴
matlab code:
%
% 一个plane一个plane的单独处理

clc;    % Clear command window.
clear;    % Delete all variables.
close all;    % Close all figure windows except those created by imtool.
imtool close all;    % Close all figure windows created by imtool.
workspace;    % Make sure the workspace panel is showing.
fontSize = 15;
% Read in a standard MATLAB color demo image.
folder = fullfile(matlabroot, ‘\toolbox\images\imdemos‘);
baseFileName = ‘peppers.png‘;
% Get the full filename, with path prepended.
fullFileName = fullfile(folder, baseFileName);
if ~exist(fullFileName, ‘file‘)
    % Didn‘t find it there.  Check the search path for it.
    fullFileName = baseFileName; % No path this time.
    if ~exist(fullFileName, ‘file‘)
        % Still didn‘t find it.  Alert user.
        errorMessage = sprintf(‘Error: %s does not exist.‘, fullFileName);
        uiwait(warndlg(errorMessage));
        return;
    end
end
rgbImage = imread(fullFileName);
% Get the dimensions of the image.  numberOfColorBands should be = 3.
[rows columns numberOfColorBands] = size(rgbImage);
% Display the original color image.
subplot(3, 4, 1);
imshow(rgbImage);
title(‘Original color Image‘, ‘FontSize‘, fontSize);
% Enlarge figure to full screen.
set(gcf, ‘Position‘, get(0,‘Screensize‘));
% Extract the individual red, green, and blue color channels.
redChannel = rgbImage(:, :, 1);
greenChannel = rgbImage(:, :, 2);
blueChannel = rgbImage(:, :, 3);
% Display the individual red, green, and blue color channels.
subplot(3, 4, 2);
imshow(redChannel);
title(‘Red Channel‘, ‘FontSize‘, fontSize);
subplot(3, 4, 3);
imshow(greenChannel);
title(‘Green Channel‘, ‘FontSize‘, fontSize);
subplot(3, 4, 4);
imshow(blueChannel);
title(‘Blue Channel‘, ‘FontSize‘, fontSize);
% Generate a noisy image.  This has salt and pepper noise independently on
% each color channel so the noise may be colored.
noisyRGB = imnoise(rgbImage,‘salt & pepper‘, 0.05);
subplot(3, 4, 5);
imshow(noisyRGB);
title(‘Image with Salt and Pepper Noise‘, ‘FontSize‘, fontSize);
% Extract the individual red, green, and blue color channels.
redChannel = noisyRGB(:, :, 1);
greenChannel = noisyRGB(:, :, 2);
blueChannel = noisyRGB(:, :, 3);
% Display the noisy channel images.
subplot(3, 4, 6);
imshow(redChannel);
title(‘Noisy Red Channel‘, ‘FontSize‘, fontSize);
subplot(3, 4, 7);
imshow(greenChannel);
title(‘Noisy Green Channel‘, ‘FontSize‘, fontSize);
subplot(3, 4, 8);
imshow(blueChannel);
title(‘Noisy Blue Channel‘, ‘FontSize‘, fontSize);
% Median Filter the channels:
redMF = medfilt2(redChannel, [3 3]);
greenMF = medfilt2(greenChannel, [3 3]);
blueMF = medfilt2(blueChannel, [3 3]);
% Find the noise in the red.
noiseImage = (redChannel == 0 | redChannel == 255);
% Get rid of the noise in the red by replacing with median.
noiseFreeRed = redChannel;
noiseFreeRed(noiseImage) = redMF(noiseImage);
% Find the noise in the green.
noiseImage = (greenChannel == 0 | greenChannel == 255);
% Get rid of the noise in the green by replacing with median.
noiseFreeGreen = greenChannel;
noiseFreeGreen(noiseImage) = greenMF(noiseImage);
% Find the noise in the blue.
noiseImage = (blueChannel == 0 | blueChannel == 255);
% Get rid of the noise in the blue by replacing with median.
noiseFreeBlue = blueChannel;
noiseFreeBlue(noiseImage) = blueMF(noiseImage);
% Reconstruct the noise free RGB image
rgbFixed = cat(3, noiseFreeRed, noiseFreeGreen, noiseFreeBlue);
subplot(3, 4, 9);
imshow(rgbFixed);
title(‘Restored Image‘, ‘FontSize‘, fontSize);
实验结果:
Applying vector median filter on RGB image based on matlab
标签:
原文地址:http://www.cnblogs.com/Matrix420/p/5701418.html