标签:
Trace是轻量级的追踪工具,几乎对系统没有任何副作用,开启Trace,经常能够帮助DBA追踪到一些非常有用的信息。Trace出现的比较早,MS推出更强大的Extended Events来取代Trace。
This feature will be removed in a future version of Microsoft SQL Server. Avoid using this feature in new development work, and plan to modify applications that currently use this feature. Use Extended Events instead.
一,使用TSQL Script创建SQL Trace
step1,使用 sp_trace_create 创建Trace的定义
sp_trace_create only creates a trace definition. This stored procedure cannot be used to start or change a trace.
sp_trace_create [ @traceid = ] trace_id OUTPUT
          , [ @options = ] option_value
          , [ @tracefile = ] ‘trace_file‘
     [ , [ @maxfilesize = ] max_file_size ]
     [ , [ @stoptime = ] ‘stop_time‘ ]
     [ , [ @filecount = ] ‘max_rollover_files‘ ]
step2,使用 sys.sp_trace_setevent 为trace添加Event和Column
Adds or removes an event or event column to a trace. sp_trace_setevent may be executed only on existing traces that are stopped (status is 0). An error is returned if this stored procedure is executed on a trace that does not exist or whose status is not 0.
sp_trace_setevent [ @traceid = ] trace_id
          , [ @eventid = ] event_id
          , [ @columnid = ] column_id
          , [ @on = ] on
step3, 使用 sys.sp_trace_setfilter 为Trace 设置过滤器,也可以不设置
sp_trace_setfilter [ @traceid = ] trace_id
          , [ @columnid = ] column_id
          , [ @logical_operator = ] logical_operator
          , [ @comparison_operator = ] comparison_operator
          , [ @value = ] value
Step4,使用 sys.sp_trace_setstatus 启动或停止Trace
Modifies the current state of the specified trace.
sp_trace_setstatus [ @traceid = ] trace_id , [ @status = ] status
status 参数的可用值是:
0:Stops the specified trace.
1:Starts the specified trace.
2:Closes the specified trace and deletes its definition from the server.
二,使用SQL Profile来创建SQL Trace
SQL Profile是一个可视化的创建SQL Trace的工具,创建Trace的过程十分直观,简单,相比之下,使用TSQL Script来创建SQL Trace十分繁琐。SQL Server Profile 有一个非常cool的功能,就是能够导出创建SQL Trace的Script。
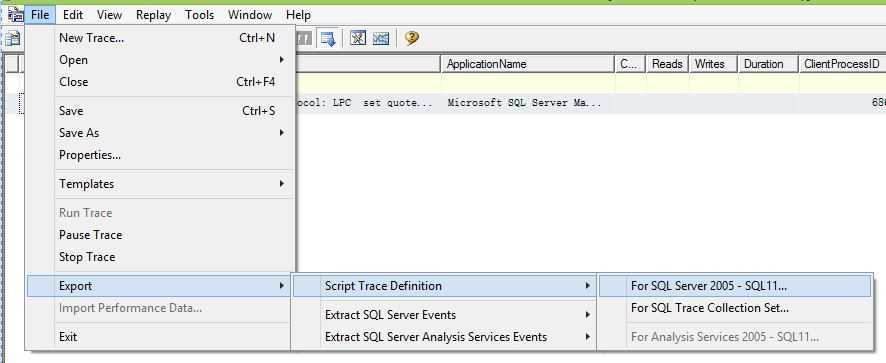
创建Trace之后,点击File->Export->Scipt Trace Definition,就能将SQL Profile创建Trace的脚本代码导出。
导出的Script 如下,不能直接使用,必须修改一处代码:在创建Trace时,指定存储trace数据的File 或 Table。仅此而已。
-- Create a Queue
declare @rc int
declare @TraceID int
declare @maxfilesize bigint
set @maxfilesize = 5

-- Client side File and Table cannot be scripted
exec @rc = sp_trace_create @TraceID output, 0, N‘InsertFileNameHere‘, @maxfilesize, NULL
if (@rc != 0) goto error

-- Set the events
declare @on bit
set @on = 1
exec sp_trace_setevent @TraceID, 14, 1, @on
exec sp_trace_setevent @TraceID, 14, 9, @on

--delete many commands here ---

-- Set the Filters
declare @intfilter int
declare @bigintfilter bigint
exec sp_trace_setfilter @TraceID, 1, 0, 6, N‘%drop%‘

-- Set the trace status to start
exec sp_trace_setstatus @TraceID, 1

-- display trace id for future references
select TraceID=@TraceID
goto finish

error:
select ErrorCode=@rc

finish:
go
参考doc:
标签:
原文地址:http://www.cnblogs.com/ljhdo/p/5723650.html