‘Common Excel Chart Types
‘-------------------------------------------------------------------
‘Chart | VBA Constant (ChartType property of Chart object) |
‘==================================================================
‘Column | xlColumnClustered, xlColumnStacked, xlColumnStacked100|
‘Bar | xlBarClustered, xlBarStacked, xlBarStacked100 |
‘Line | xlLine, xlLineMarkersStacked, xlLineStacked |
‘Pie | xlPie, xlPieOfPie |
‘Scatter | xlXYScatter, xlXYScatterLines |
‘-------------------------------------------------------------------
Public Sub AddChartSheet()
Dim dataRange As Range
Set dataRange = ActiveWindow.Selection
Charts.Add ‘Create a chart sheet
With ActiveChart ‘Set chart properties
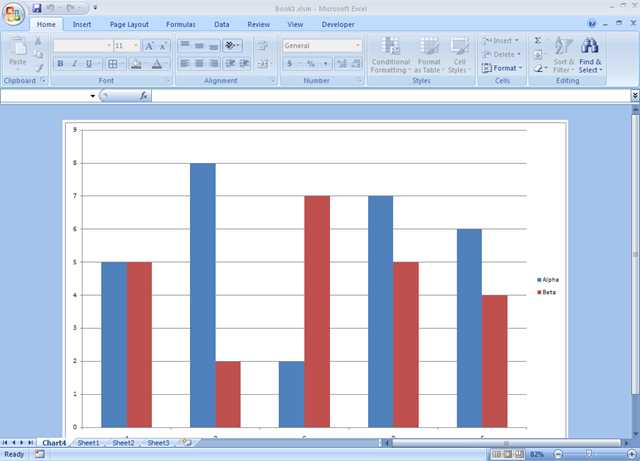
.ChartType = xlColumnClustered
.HasLegend = True
.Legend.Position = xlRight
.Axes(xlCategory).MinorTickMark = xlOutside
.Axes(xlValue).MinorTickMark = xlOutside
.Axes(xlValue).MaximumScale = _
Application.WorksheetFunction.RoundUp( _
Application.WorksheetFunction.Max(dataRange), -1)
.Axes(xlCategory).HasTitle = True
.Axes(xlCategory).AxisTitle.Characters.Text = "X-axis Labels"
.Axes(xlValue).HasTitle = True
.Axes(xlValue).AxisTitle.Characters.Text = "Y-axis"
.SeriesCollection(1).name = "Sample Data"
.SeriesCollection(1).Values = dataRange
End With
End Sub
![]() Chart Export
Chart Export ![]() Chart Format
Chart Format ![]() Chart Lengend
Chart Lengend ![]() Chart Protect
Chart Protect ![]() Chart Title
Chart Title ![]() Chart
Chart 
 可以手动给该图表添加Data Labels,方法是选中任意的series,右键选择Add Data Labels。如果想要为所有的series添加Data Labels,则需要依次选择不同的series,然后重复该操作。
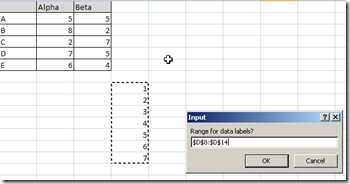
  注意VBA中输入型对话框Application.InputBox的使用。在循环中将Range中的值添加到Chart的Data Labels中。