标签:
web性能测试的方法请参考此连接说明:http://www.xenoclast.org/doc/benchmark/
ftp://ftp.hpl.hp.com/pub/httperf/ 下载
解压然后安装,执行程序在安装目录下的src目录中
./httperf –server 192.168.210.155 –port 10002 –uri /index.html –rate 300 –num-conn 30000 –num-call 1 –timeout 5*
??num?calls=_It specifies the total number of calls to issue on each connection before closing it
??num?connsthe total number of connections to create
httperf: warning: open file limit > FD_SETSIZE; limiting max. # of open files to FD_SETSIZE
Maximum connect burst length: 51
Total: connections 30000 requests 30000 replies 30000 test-duration 100.004 s
Connection rate: 300.0 conn/s (3.3 ms/conn, <=52 concurrent connections)
Connection time [ms]: min 0.5 avg 3.5 max 113.7 median 3.5 stddev 4.6
Connection time [ms]: connect 1.2
Connection length [replies/conn]: 1.000
Request rate: 300.0 req/s (3.3 ms/req)
Request size [B]: 78.0
Reply rate [replies/s]: min 290.2 avg 300.0 max 309.8 stddev 3.3 (19 samples)
Reply time [ms]: response 2.3 transfer 0.1
Reply size [B]: header 238.0 content 612.0 footer 0.0 (total 850.0)
Reply status: 1xx=0 2xx=30000 3xx=0 4xx=0 5xx=0
CPU time [s]: user 52.07 system 47.29 (user 52.1% system 47.3% total 99.4%)
Net I/O: 271.9 KB/s (2.2*10^6 bps)
Errors: total 0 client-timo 0 socket-timo 0 connrefused 0 connreset 0
Errors: fd-unavail 0 addrunavail 0 ftab-full 0 other 0
total: 表示总体情况
Connection:tcp 连接的相关统计信息,Connection length可能>1(由于persistent-connections)
Request rate:HTTP报文的发送统计信息
Reply rate: time表示发送第一个包到接收第一个包的时间, transfer表示读取接收报文的时间
对httperf进行了封装,不仅仅只测试一个条件的结果,可以连续增加测试量,从而测试出性能的瓶颈
下载地址: http://www.xenoclast.org/autobench/
默认的配置文件如下所示:
more autobench.conf
注意: 一定要将配置文件copy到所用用户的家目录下,因此程序执行需要读取这个文件;安装后默认在/usr/local/etc/autobench.conf
# Autobench Configuration File# host1, host2# The hostnames of the servers under test# Eg. host1 = iis.test.com# host2 = apache.test.comhost1 = testhost1host2 = testhost2# uri1, uri2# The URI to test (relative to the document root). For a fair comparison# the files should be identical (although the paths to them may differ on the# different hosts)uri1 = /uri2 = /# port1, port2# The port number on which the servers are listeningport1 = 80port2 = 80# low_rate, high_rate, rate_step# The ‘rate‘ is the number of number of connections to open per second.# A series of tests will be conducted, starting at low rate,# increasing by rate step, and finishing at high_rate.# The default settings test at rates of 20,30,40,50...180,190,200low_rate = 20high_rate = 200rate_step = 10# num_conn, num_call# num_conn is the total number of connections to make during a test# num_call is the number of requests per connection# The product of num_call and rate is the the approximate number of# requests per second that will be attempted.num_conn = 5000num_call = 10# timeout sets the maximimum time (in seconds) that httperf will wait# for replies from the web server. If the timeout is exceeded, the# reply concerned is counted as an error.timeout = 5# output_fmt# sets the output type - may be either "csv", or "tsv";output_fmt = tsv## Config for distributed autobench (autobench_admin)# clients# comma separated list of the hostnames and portnumbers for the# autobench clients. No whitespace can appear before or after the commas.# clients = bench1.foo.com:4600,bench2.foo.com:4600,bench3.foo.com:4600clients = localhost:4600
执行测试命令
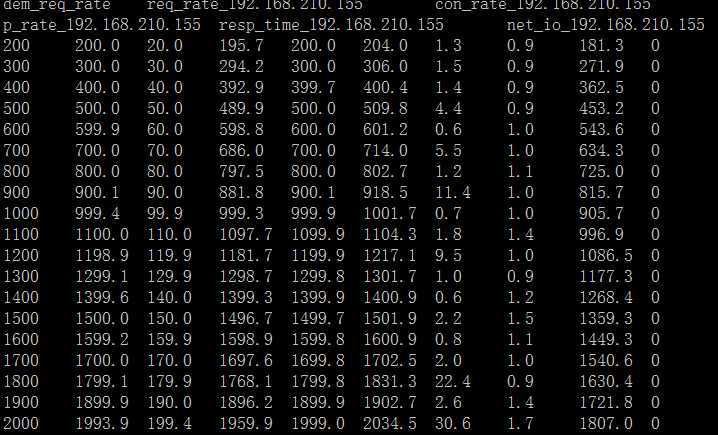
./autobench –single_host –host1 192.168.210.155 –port1 10002 –uri1 /index.html –quiet –low_rate 20 –high_rate 200 –rate_step 20 –num_call 10 –num_conn 5000 –timeout 5 –file results.tsv
httperf: warning: open file limit > FD_SETSIZE; limiting max. # of open files to FD_SETSIZE
如果不添加参数,则默认使用配置文件中的参数
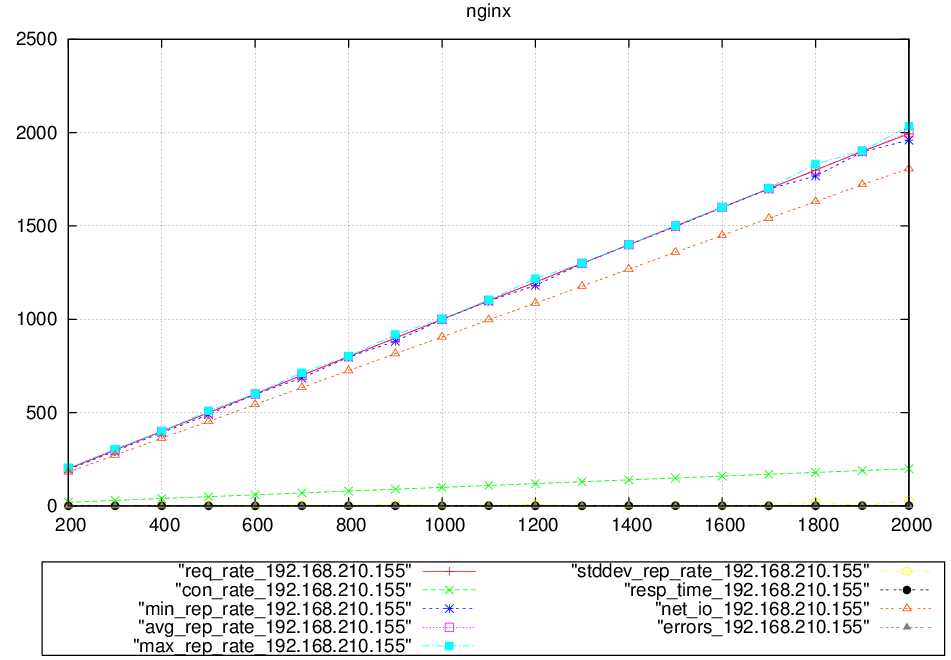
最后的结果是tsv格式的文件,可以使用1.10版本后自带的工具,通过gnuplot画图得出图形结果
bench2graph takes a TSV format autobench results file, and uses gnuplot to graph the results, producing output in Postscript.
注意生成的图片格式是Postscript
./bench2graph results-1.tsv results-1.ps

windows下建议使用 GhostView来打开图片

标签:
原文地址:http://www.cnblogs.com/roni/p/5774923.html