标签:
今天给大家总结一下matplotlib绘图时如何设置刻度,希望对正在学习matplotlib的同学有帮助。
Tick locating and formatting
该模块包括许多类以支持完整的刻度位置和格式的配置。尽管 locators 与主刻度或小刻度没有关系,他们经由 Axis 类使用来支持主刻度和小刻度位置和格式设置。一般情况下,刻度位置和格式均已提供,通常也是最常用的形式。
默认格式
当x轴数据绘制在一个大间隔的一个小的集中区域时,默认的格式将会生效。为了减少刻度标注重叠的可能性,刻度被标注在固定间隔之间的空白区域。比如:
ax.plot(np.arange(2000, 2010), range(10))
表现形式如下:
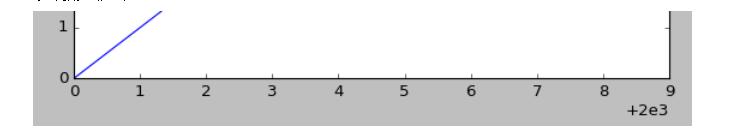
刻度仅标注了 0-9 以及一个间隔 +2e3 。如果不希望这种形式,可以关闭默认格式设置中的间隔标注的使用。
ax.get_xaxis().get_major_formatter().set_useOffset(False)
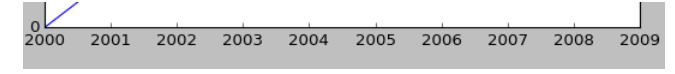
设置 rcParam axes.formatter.useoffset=False 以在全局上关闭,或者设置不同的格式。
刻度位置
Locator 类是所有刻度 Locators 的基类。 locators 负责根据数据的范围自动调整视觉间隔,以及刻度位置的选择。 MultipleLocator 是一种有用的半自动的刻度 Locator。 你可以通过基类进行初始化设置等等。
Locator 子类定义如下:
|
NullLocator |
No ticks |
|
FixedLocator |
Tick locations are fixed |
|
IndexLocator |
locator for index plots (e.g., where x = range(len(y))) |
|
LinearLocator |
evenly spaced ticks from min to max |
|
LogLocator |
logarithmically ticks from min to max |
|
SymmetricalLogLocator |
locator for use with with the symlog norm, works like the LogLocator for the part outside of the threshold and add 0 if inside the limits |
|
MultipleLocator |
ticks and range are a multiple of base;either integer or float |
|
OldAutoLocator |
choose a MultipleLocator and dyamically reassign it for intelligent ticking during navigation |
|
MaxNLocator |
finds up to a max number of ticks at nice locations |
|
AutoLocator |
MaxNLocator with simple defaults. This is the default tick locator for most plotting. |
|
AutoMinorLocator |
locator for minor ticks when the axis is linear and the major ticks are uniformly spaced. It subdivides the major tick interval into a specified number of minor intervals, defaulting to 4 or 5 depending on the major interval. |
你可以继承 Locator 定义自己的 locator。 你必须重写 ___call__ 方法,该方法返回位置的序列,你可能也想重写 autoscale 方法以根据数据的范围设置视觉间隔。
如果你想重写默认的locator,使用上面或常用的locator任何一个, 将其传给 x 或 y axis 对象。相关的方法如下:
ax.xaxis.set_major_locator( xmajorLocator )ax.xaxis.set_minor_locator( xminorLocator )ax.yaxis.set_major_locator( ymajorLocator )ax.yaxis.set_minor_locator( yminorLocator )
刻度格式
刻度格式由 Formatter 继承来的类控制。 formatter仅仅作用于单个刻度值并且返回轴的字符串。
相关的子类请参考官方文档。
同样也可以通过重写 __all__ 方法来继承 Formatter 基类以设定自己的 formatter。
为了控制主刻度或小刻度标注的格式,使用下面任一方法:
ax.xaxis.set_major_formatter( xmajorFormatter )ax.xaxis.set_minor_formatter( xminorFormatter )ax.yaxis.set_major_formatter( ymajorFormatter )ax.yaxis.set_minor_formatter( yminorFormatter )
设置刻度标注
原型举例:
set_xticklabels(labels, fontdict=None, minor=False, **kwargs)
综合举例(1)如下:
设置指定位置的标注更改为其他的标注:
...
plt.xticks([-np.pi, -np.pi/2, 0, np.pi/2, np.pi],
[r’$-\pi$’, r’$-\pi/2$’, r’$0$’, r’$+\pi/2$’, r’$+\pi$’])
plt.yticks([-1, 0, +1],
[r’$-1$’, r’$0$’, r’$+1$’])
...
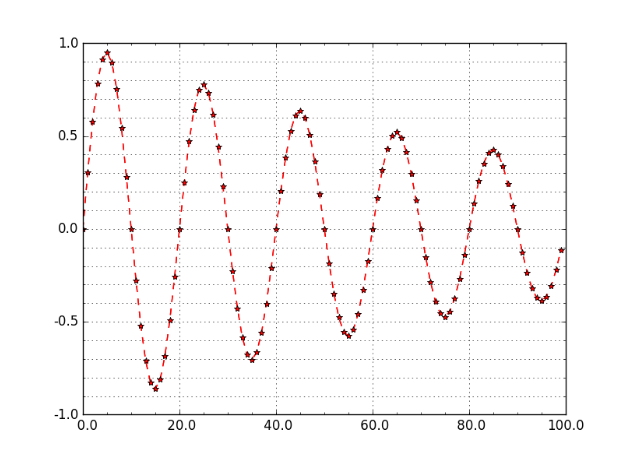
综合举例(2)如下:
设置坐标轴主刻度和次刻度。
#!/usr/bin/env python#-*- coding: utf-8 -*- #---------------------------------------------------#演示MatPlotLib中设置坐标轴主刻度标签和次刻度标签.
#对于次刻度显示,如果要使用默认设置只要matplotlib.pyplot.minorticks_on()
#---------------------------------------------------
import numpy as npimport matplotlib.pyplot as pltfrom matplotlib.ticker import MultipleLocator, FormatStrFormatter
#---------------------------------------------------
xmajorLocator = MultipleLocator(20) #将x主刻度标签设置为20的倍数
xmajorFormatter = FormatStrFormatter(’%5.1f’) #设置x轴标签文本的格式
xminorLocator = MultipleLocator(5) #将x轴次刻度标签设置为5的倍数
ymajorLocator = MultipleLocator(0.5) #将y轴主刻度标签设置为0.5的倍数
ymajorFormatter = FormatStrFormatter(’%1.1f’) #设置y轴标签文本的格式
yminorLocator = MultipleLocator(0.1) #将此y轴次刻度标签设置为0.1的倍数
t = np.arange(0.0, 100.0, 1)
s = np.sin(0.1*np.pi*t)*np.exp(-t*0.01)
ax = plt.subplot(111) #注意:一般都在ax中设置,不再plot中设置
plt.plot(t,s,’--r*’)
#设置主刻度标签的位置,标签文本的格式
ax.xaxis.set_major_locator(xmajorLocator)
ax.xaxis.set_major_formatter(xmajorFormatter)
ax.yaxis.set_major_locator(ymajorLocator)
ax.yaxis.set_major_formatter(ymajorFormatter)
#显示次刻度标签的位置,没有标签文本
ax.xaxis.set_minor_locator(xminorLocator)
ax.yaxis.set_minor_locator(yminorLocator)
ax.xaxis.grid(True, which=’major’) #x坐标轴的网格使用主刻度
ax.yaxis.grid(True, which=’minor’) #y坐标轴的网格使用次刻度
plt.show()
##########################################################
图像形式如下:
文章来自:博客园/Chris*Chen
标签: