标签:
直接上代码:
import matplotlib.pylab as plt
import numpy as np
plt.figure()
axes=plt.gca()
y= np.random.randn(9)
col_labels=[‘col1‘,‘col2‘,‘col3‘]
row_labels=[‘row1‘,‘row2‘,‘row3‘]
table_vals=[[11,12,13],[21,22,23],[28,29,30]]
row_colors=[‘red‘,‘gold‘,‘green‘]
col_colors=[‘blue‘,‘gold‘,‘green‘]
the_table = plt.table(cellText=table_vals,
                  colWidths = [0.1]*3,
                  rowLabels=row_labels,
                  colLabels=col_labels,
                  rowColours=row_colors,
                  colColours=col_colors,
                  loc=‘upper right‘)
plt.text(12,3.4,‘Table Title‘,size=8)
plt.plot(y)
plt.show()
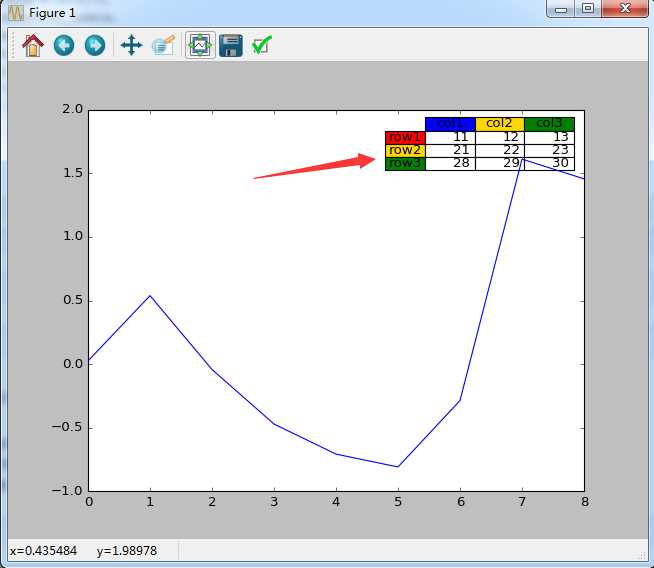
运行结果如下:

标签:
原文地址:http://www.cnblogs.com/zhouxiaohui888/p/5799407.html