
标签:
import matplotlib.pyplot as plt

# The slices will be ordered and plotted counter-clockwise.
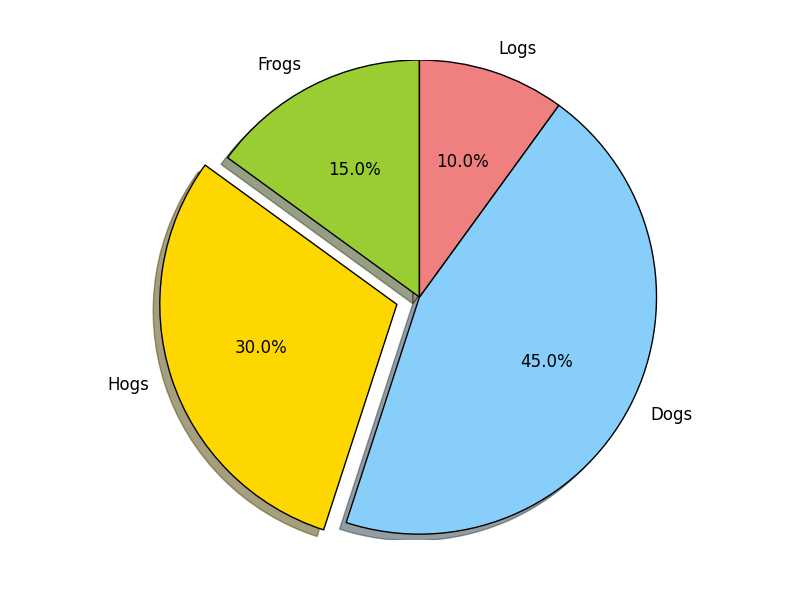
labels = ‘Frogs‘, ‘Hogs‘, ‘Dogs‘, ‘Logs‘
sizes = [15, 30, 45, 10]
colors = [‘yellowgreen‘, ‘gold‘, ‘lightskyblue‘, ‘lightcoral‘]
explode = (0, 0.1, 0, 0) # only "explode" the 2nd slice (i.e. ‘Hogs‘)

plt.pie(sizes, explode=explode, labels=labels, colors=colors,
autopct=‘%1.1f%%‘, shadow=True, startangle=90)

# Set aspect ratio to be equal so that pie is drawn as a circle.
plt.axis(‘equal‘)


plt.savefig(‘D:\\pie.png‘)
plt.show()
标签:
原文地址:http://www.cnblogs.com/wanghuaijun/p/5822508.html
