标签:
1、坐标点类
package cn.test.domain;

public class Point {
    double x;
    double y;

    public Point(){

    }

    public Point(double x, double y) {
        super();
        this.x = x;
        this.y = y;
    }

    public double getX() {
        return x;
    }

    public void setX(double x) {
        this.x = x;
    }

    public double getY() {
        return y;
    }

    public void setY(double y) {
        this.y = y;
    }
}
2、拟合类,带计算部分
package cn.test.normcdf;

import java.io.IOException;
import java.text.NumberFormat;
import java.util.ArrayList;
import java.util.Collections;
import java.util.List;

import javax.servlet.ServletException;
import javax.servlet.http.HttpServlet;
import javax.servlet.http.HttpServletRequest;
import javax.servlet.http.HttpServletResponse;

import net.sf.json.JSONArray;
import net.sf.json.JSONObject;

import org.apache.commons.math3.distribution.NormalDistribution;

import cn.test.domain.Point;

public class TestNormCdf extends HttpServlet {

    private ArrayList<Double> cyis = null;
    private ArrayList<Double> axis = null;

    public void doGet(HttpServletRequest request, HttpServletResponse response)
            throws ServletException, IOException {
        axis = new ArrayList<Double>();
        cyis = new ArrayList<Double>();
        // 初始化横坐标值
        axis = initial(axis);
        /* axis = stand(axis); */
        // 计算纵坐标值
        //NormalDistribution normal = new NormalDistribution();
        // 先排序
        Collections.sort(axis);
        int n = axis.size();
/*        for (int i = 0; i < axis.size(); i++) {
            cyis.add(normal.inverseCumulativeProbability((i + 1 - 0.5) / n));
        }*/
        for (int i = 0; i < axis.size(); i++) {
            cyis.add((i + 1 - 0.5) / n);
        }

          double sumX = getSum(axis);
          double sumY = getSum(cyis);
          double sumP2X = getPowSum(axis);
          double sumXY = getSumXY(axis, cyis);
          double a =(sumXY - (1 / axis.size()) * sumX * sumY) / (sumP2X - (1 /axis.size()) * sumX * sumX);
          double b = (1 / axis.size()) * (sumY - a*sumX);
          double pointx1 = axis.get(0);
          double pointx2 = axis.get(n - 1);
          double pointy1 = b+a * pointx1;
          double pointy2 = b+a * pointx2;
        //cyis = stand2(cyis);
        /*double x1 = axis.get((int) (n * 0.75));
        double x2 = axis.get((int) (n * 0.25));
        double y1 = cyis.get((int) (n * 0.75));
        double y2 = cyis.get((int) (n * 0.25));
        double dx = x1 - x2;
        double dy = y1 - y2;
        double a = dy / dx;
        double pointx1 = axis.get(0);
        double pointx2 = axis.get(n - 1);
        double centreX = 0.5 * (x1 + x2);
        double centreY = 0.5 * (y1 + y2);
        double pointy1 = centreY - a * (centreX - pointx1);
        double pointy2 = centreY + a * (pointx2 - centreX);*/
        Double[][] array = new Double[axis.size() + 2][2];
        NumberFormat ddf1 = NumberFormat.getNumberInstance();
        ddf1.setMaximumFractionDigits(4);
        for (int i = 0; i < axis.size(); i++) {
            array[i][0] = Double.valueOf(ddf1.format(axis.get(i)));
            array[i][1] = Double.valueOf(ddf1.format(cyis.get(i)));
        }
        array[axis.size()][0] = Double.valueOf(ddf1.format(pointx1));
        array[axis.size()][1] = Double.valueOf(ddf1.format(pointy1));
        array[axis.size() + 1][0] = Double.valueOf(ddf1.format(pointx2));
        array[axis.size() + 1][1] = Double.valueOf(ddf1.format(pointy2));
        response.getWriter().write(JSONArray.fromObject(array).toString());
    }

    public ArrayList<Double> stand2(ArrayList<Double> cyis) {
        int n = cyis.size();
        NormalDistribution normal = new NormalDistribution();
        for (int i = 0; i < cyis.size(); i++) {
            cyis.set(i, normal.cumulativeProbability(cyis.get(i)));
        }
        return cyis;
    }

    /*
     * public ArrayList<Double> stand(ArrayList<Double> list) { double average =
     * getAverage(list); double std = getStdVariance(list); for (int i = 0; i <
     * list.size(); i++) { list.set(i, (list.get(i) - average) / std); } return
     * list; }
     *
     * public double getStdVariance(ArrayList<Double> list) { double std = 0.0;
     * double average = getAverage(list); for (int i = 0; i < list.size(); i++)
     * { std += Math.pow((list.get(i) - average), 2); } return std /
     * list.size(); }
     *
     * public double getAverage(ArrayList<Double> list) { return getSum(list) /
     * list.size(); }
     */

    public double getSum(ArrayList<Double> list) {
        double sum = 0.0;
        for (Double value : list) {
            sum += value;
        }
        return sum;
    }

    public double getSumXY(ArrayList<Double> X, ArrayList<Double> Y) {
        double sum = 0.0;
        for (int i = 0; i < X.size(); i++) {
            sum += X.get(i) * Y.get(i);
        }
        return sum;
    }

    public double getPowSum(ArrayList<Double> list) {
        double sum = 0.0;
        for (Double value : list) {
            sum += Math.pow(value, 2);
        }
        return sum;
    }

    public ArrayList<Double> initial(ArrayList<Double> axis) {
        axis = new ArrayList<Double>();
        axis.add(9.0);
        axis.add(11.0);
        axis.add(15.0);
        axis.add(20.0);
        axis.add(30.0);
        axis.add(40.0);
        axis.add(35.0);
        axis.add(80.0);
        axis.add(50.0);
        axis.add(60.0);
        axis.add(55.0);
        axis.add(45.0);
        axis.add(65.0);
        axis.add(70.0);
        axis.add(58.0);
        axis.add(72.0);
        axis.add(66.0);
        axis.add(59.0);
        return axis;
    }

    public void doPost(HttpServletRequest request, HttpServletResponse response)
            throws ServletException, IOException {
        doGet(request, response);
    }

}
3、html部分代码
    <script src="http://cdn.hcharts.cn/jquery/jquery-1.8.3.min.js"></script>
    <script src="${pageContext.request.contextPath}/js/highcharts.js" ></script>
      <script type="text/javascript">
          $(function(){
              $.post("/Test_Polyfit/TestNormCdf",null,function(data){
                             var array=eval(data);
                          $("#container").highcharts({
                              chart:{
                                  zoomType:‘xy‘
                              },
                              title:{
                                  text:‘Normal Probability of Wait Time‘
                              },
                              xAxis:{
                                  title:{
                                      enabled:true,
                                      text:‘Wait Time‘
                                  },
                                  startOnTick: true,
                                endOnTick: true,
                                showLastLabel: true
                              },
                              yAxis:{
                                  title:{
                                      text:‘Probability in normal distribution‘
                                  },
                                  min:0,
                                  max:1,
                                  staggerLines:20,
                                 allowDecimals:true
                              },
                              legend:{
                                  layout:‘vertical‘,
                                  align:‘left‘,
                                  verticalAlign: ‘top‘,
                                  x: 100,
                                y: 70,
                                floating: true,
                                backgroundColor: ‘#FFFFFF‘,
                                borderWidth: 1
                              },
                               plotOptions: {
                                    scatter: {
                                        marker: {
                                            radius: 5,
                                            states: {
                                                hover: {
                                                    enabled: true,
                                                    lineColor: ‘rgb(100,100,100)‘
                                                }
                                            }
                                        },
                                        states: {
                                            hover: {
                                                marker: {
                                                    enabled: false
                                                }
                                            }
                                        },
                                        tooltip: {
                                            headerFormat: ‘<b>{series.name}</b><br>‘,
                                            pointFormat: ‘{point.x} cm, {point.y} kg‘
                                        }
                                    }
                            },
                             series: [{
                                type:‘scatter‘,
                                name: ‘point‘,
                                color: ‘rgba(223, 83, 83, .5)‘,
                                data: array
                            },{
                                type:‘line‘,
                                name: ‘polyfitline‘,
                                color: ‘black‘,
                                data: [array.pop(),array.pop()]
                            }]
                          });
                  });
              });

      </script>
  </head>
  <body>
          <div id="container"></div>
4、最后实现的效果
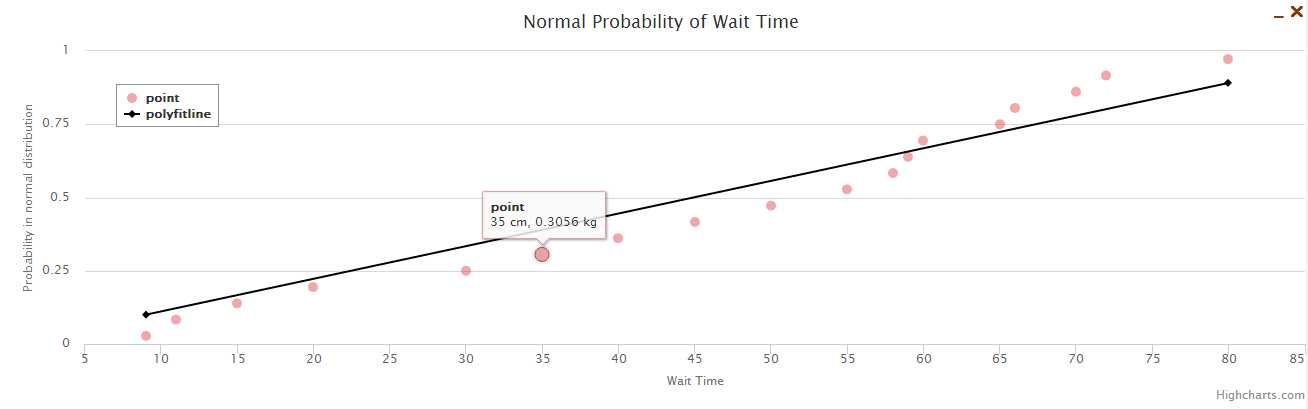
6、基于highcharts实现的线性拟合,计算部分在java中实现,画的是正态概率图
标签:
原文地址:http://www.cnblogs.com/weizhen/p/5823877.html