标签:
背景:发现一个有趣的现象,即一些用户在每一月都仅仅访问网站一次,我们想要了解这些人数量的变化趋势。
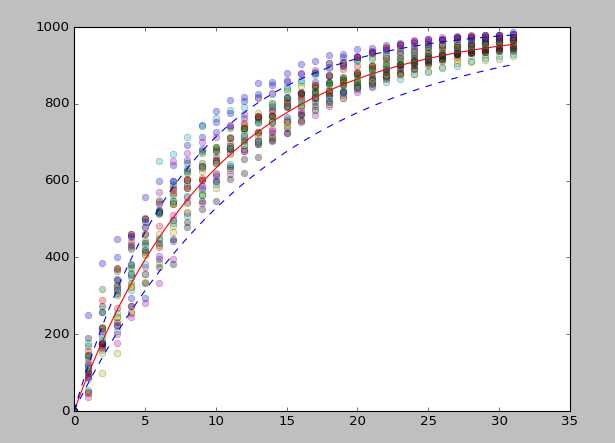
建立数学模型:简化问题,根据瓮模型推导出公式(具体推导见《数据之魅》,有时间再补充。。。):n(t)=N(1-e^((-k/N)*t)),其中,t代表一个月中的第t天,N代表潜在的总的访问人数,k为根据网站日志计算的每日平均访问量,n(t)代表第t天为止,访问此网站的用户总人数。
python模拟,并和分析的模型作比较:
import math
import random as rnd
import numpy as np
import matplotlib.pyplot as plt

n =1000  # 总的潜在用户数量
k = 100   # 平均每天的访问量
s = 50   # 每日可能访问量的浮动范围
def trial():
	visitors_for_day = [0]  # No visitors in day one

	has_visited = [0]*n    # A flag for each visitor
	for day in range(31):
		visitors_today = max(0,int(rnd.gauss(k,s)))
		# Pick the individuals who visited today and mark them
		for i in rnd.sample(range(n),visitors_today):
			has_visited[i] = 1
		# Find the total number if unique visitors so far
		visitors_for_day.append(sum(has_visited))
	return visitors_for_day

for t in range(25):
	r = trial()
	xi = []
	yi = []
	for i in range(len(r)):
		xi.append(i)
		yi.append(r[i])
		print(i,r[i])
	plt.plot(xi,yi,‘o‘,alpha=0.3)
x0 = np.linspace(0.0,31.0,num=1000)
y0 = 1000*(1-(math.e)**(-0.1*x0))
y_up = 1000*(1-(math.e)**(-0.075*x0))
y_dn = 1000*(1-(math.e)**(-0.125*x0))

plt.plot(x0,y0,‘r-‘)
plt.plot(x0,y_up,‘b--‘,x0,y_dn,‘b--‘)
plt.show()
输出图形如下:

好像开始喜欢matplotlib了呢。。。
标签:
原文地址:http://www.cnblogs.com/buzhizhitong/p/5891200.html