标签:homepage blog 上传控件 注释 项目 getpath 文件路径 复制 grid
正文
前言:最近项目里面有一些对Excel操作的需求,博主想都没想,NPOI呗,简单、开源、免费,大家都喜欢!确实,对于一些简单的Excel导入、导出、合并单元格等,它都没啥太大的问题,但是这次的需求有两点是NPOI搞不定的:
找了一圈资料,对于Excel生成pdf,网上的答案千篇一律:使用COM组件的方式,通过调用服务器上面的Office组件里面的东西去转。这种方式需要在服务器上面安装Office,这倒是其次,最重要的是,权限的问题很头疼。博主已经按照这种方式实现了,调试的时候没问题,部署到IIS上面之后又出了各种权限的问题,好不容易在一台服务器上面部署成功了,放到另一台服务器上面按照同样的方式部署,却还是提示“拒绝访问”。博主也是醉了。而对于Excel生成图表,NPOI暂时没找到实现方式,COM组件的方式可以,但是实现起来略显复杂,并且这东西庞大、不太稳定,尤其是咱们大部分人个人电脑上面装的Office都不是正版,使用起来也很蛋疼。
基于此,经过一番努力,找到了这么一个第三方组件Spire.XLS。这两天体验了一把,使用起来还比较顺手,在此来简单介绍下这个组件的使用吧。
本文原创地址:http://www.cnblogs.com/landeanfen/p/5888973.html
Spire.XLS系列文章:
Spire.XLS是E-iceblue开发的一套基于企业级的专业Office文档处理的组件之一,全称Spire.Office for .NET。旗下有Spire.Doc,Spire XLS,Spire.PDF,Spire.BarCode等多款专业组件,为各种Office文档在程序处理上提供了很大的方便,官方为各种功能提供了大量的在线api,简化了使用组件的难度。组件使用时不需要本地Office组件的支持。Spire.Office是一款企业级组件,它提供了收费版本和免费版本两种级别,一般来说,对于个人的应用,免费版本已足够用。比如对于上文博主遇到的问题,Spire.XLS组件就提供了很好的实现机制,如果你也遇到了NPOI解决不了的问题,不妨试试这个。
“XLS”是Excel文件的后缀之一,顾名思义,Spire.XLS当然就是针对Excel表格处理的组件喽,本篇,博主将结合上文遇到的问题来看看Spire.XLS组件的强大功能。
对于组件的安装,在此还是提供两种方式:
下载地址。官方下载的安装包是msi结尾的,安装时需要选择支持的VS版本等信息,软件的安装就不做过多说明,有兴趣的可以下载试试。
大家最喜欢的应该还是Nuget方式吧,简单,方便,并且易于管理。博主也是不太喜欢为了一个组件而去单独下载一个安装包。
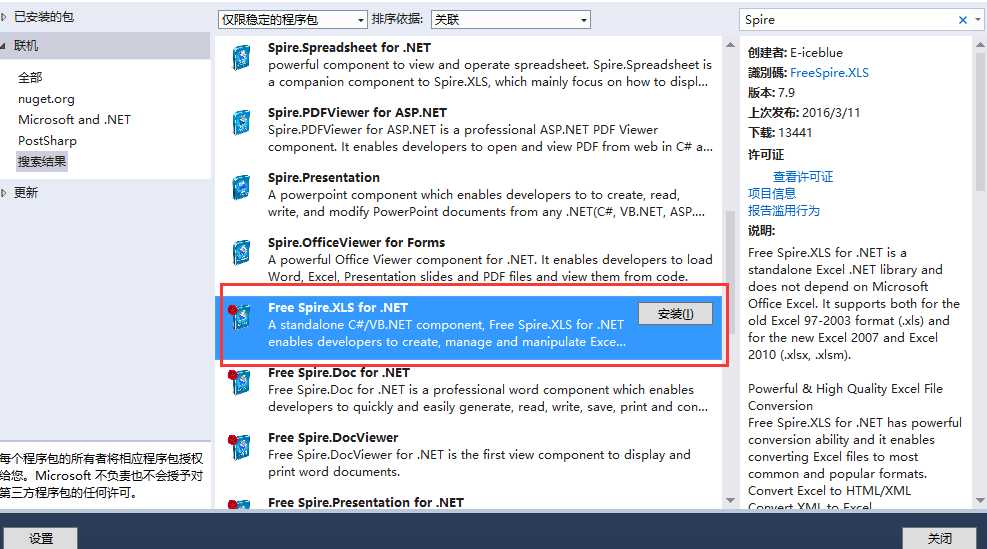
Spire.XLS也提供了Nuget的方式,只需要搜索Spire,选择免费版的组件即可:
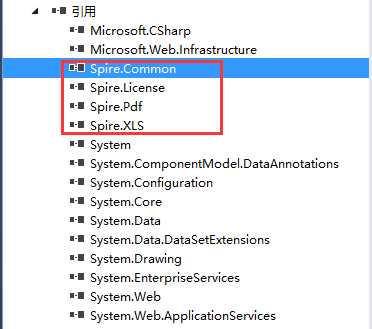
安装完成后自动引用了需要的dll
关于Excel的一些常用操作,比如取值、赋值、设置单元格样式等,这里就不做过多介绍,无论是Com组件、NPOI还是Aspose,这些都是最基础的功能。下面就针对上文提出的几个问题着重说明下。
关于Excel转PDF的实现,网上找到的解决方案基本一样,大致代码如此:

      /// <summary>
         /// 把Excel文件转换成PDF格式文件
         /// </summary>
         /// <param name="sourcePath">源文件路径</param>
         /// <param name="targetPath">目标文件路径</param>
         /// <returns>true=转换成功</returns>
        public bool XLSConvertToPDF(string sourcePath, string targetPath)
        {
            Logger.Info("开始转pdf");
            bool result = false;
            XlFixedFormatType targetType = XlFixedFormatType.xlTypePDF;
            object missing = Type.Missing;
            Microsoft.Office.Interop.Excel.Application application = null;
            Microsoft.Office.Interop.Excel.Workbook workBook = null;
            try
            {
                application = new Application();
                application.Interactive = false;
                object target = targetPath;
                object type = targetType;
                workBook = application.Workbooks.Open(sourcePath, missing, missing, missing, missing, missing,
                    missing, missing, missing, missing, missing, missing, missing, missing, missing);
                application.Interactive = true;
                workBook.ExportAsFixedFormat(targetType, target, XlFixedFormatQuality.xlQualityStandard, true, false, missing, missing, missing, missing);
                result = true;
            }
            catch(Exception ex)
            {
                Logger.Error("excel转pdf异常,异常信息:" + ex.Message + "。堆栈信息:" + ex.StackTrace);
                result = false;
            }
            finally
            {
                if (workBook != null)
                {
                    workBook.Close(true, missing, missing);
                    workBook = null;
                }
                if (application != null)
                {
                    application.Quit();
                    application = null;
                }
                GC.Collect();
                GC.WaitForPendingFinalizers();
                GC.Collect();
                GC.WaitForPendingFinalizers();
            }
            return result;
        }
这个方法需要依赖于本机上面的office Com组件,如果你安装Office的时候,没有安装com组件相关的dll,这个方法也是用不了的,并且还有一个最大的问题就是执行 application.Workbooks.Open(sourcePath, missing, missing, missing, missing, missing, missing, missing, missing, missing, missing, missing, missing, missing, missing); 这一个方法的时候需要当前用户有操作Excel Application这个组件的权限,尤其是部署到IIS上面之后,需要配置一系列的权限,很是麻烦。
通过上文,我们知道,Spire.Office提供了Spire.XLS和Spire.PDF两个组件,那么他们之间的转换就简单了。我们还是模拟一个文件上传的功能。
前端有一个上传控件:
<input type="file" name="txt_file" id="txt_file" class="file-loading" />
后台有一个接收上传文件的方法如下:
     [HttpPost]
        public JsonResult UploadFile()
        {
            var strRes = string.Empty;
            var oFile = Request.Files["txt_file"];
            Workbook book = new Workbook();
            book.LoadFromStream(oFile.InputStream);
            var strFullName = @"D:\Data\Upload\" + "First" + DateTime.Now.ToString("yyyyMMddHHmmss") + ".pdf";
            book.SaveToPdf(strFullName);
            return Json(new object { }, JsonRequestBehavior.AllowGet);
        }
就这么简单的几句话即可实现将上传的Excel转成PDF文件。根据源文件生成Workbook对象,Spire.XLS提供了多种方式,我们最常用的两种方式如下:
// 根据文件路径生成workbook.
        public void LoadFromFile(string fileName);
// 根据文件流生成workbook.
        public void LoadFromStream(Stream stream);
2.1、最原始的转换
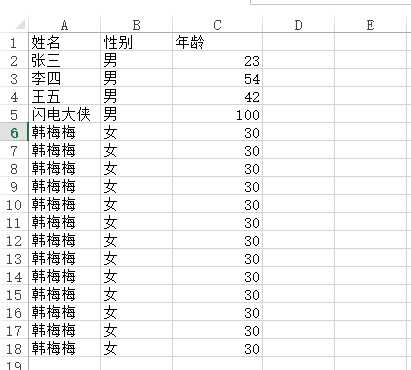
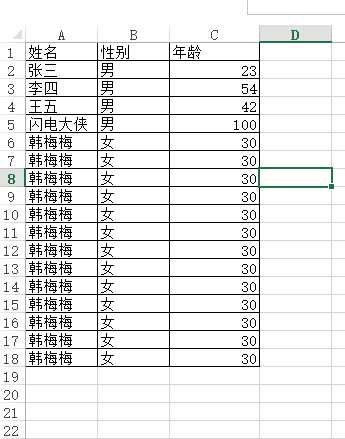
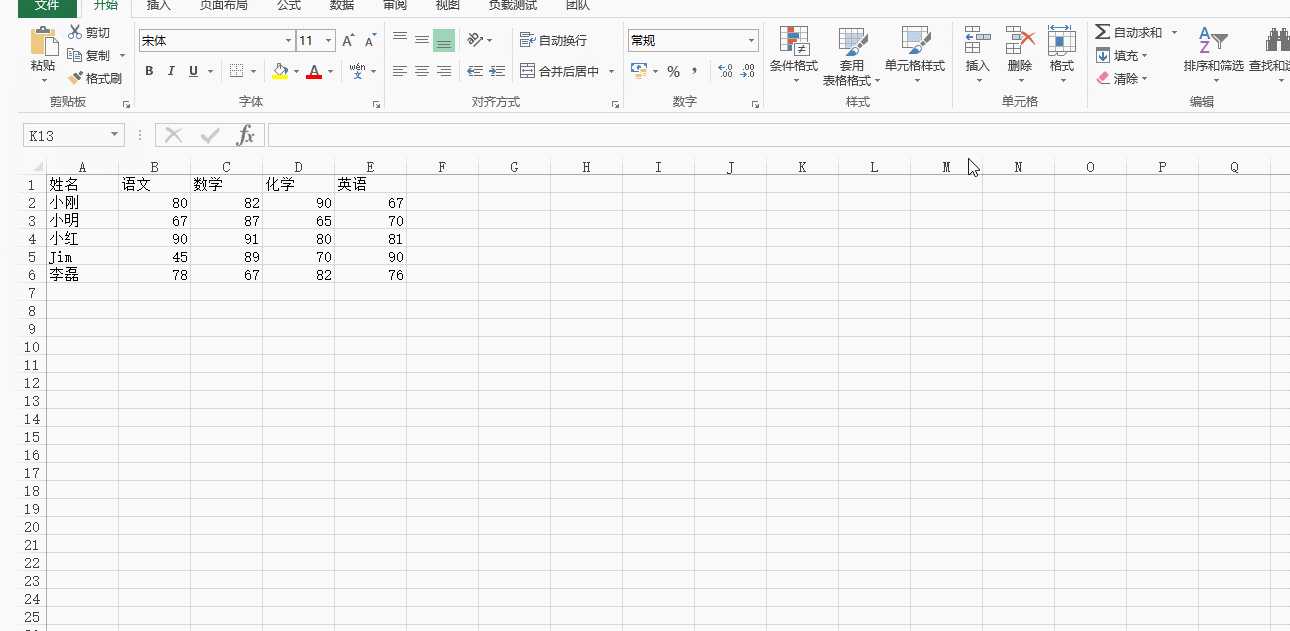
原始Excel文件:
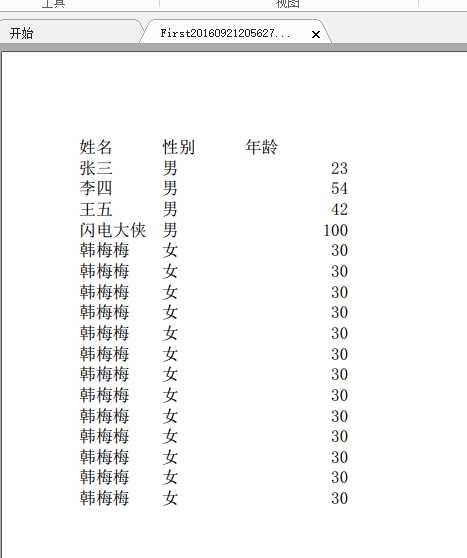
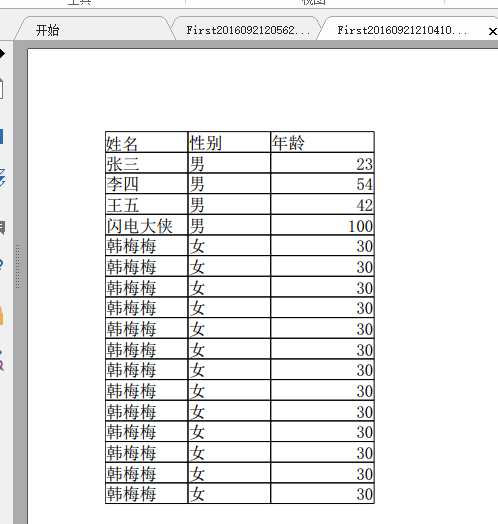
转换成PDF之后
2.2、不好看?加一个边框即可。
转换之后
2.3、自定义转换的PDF
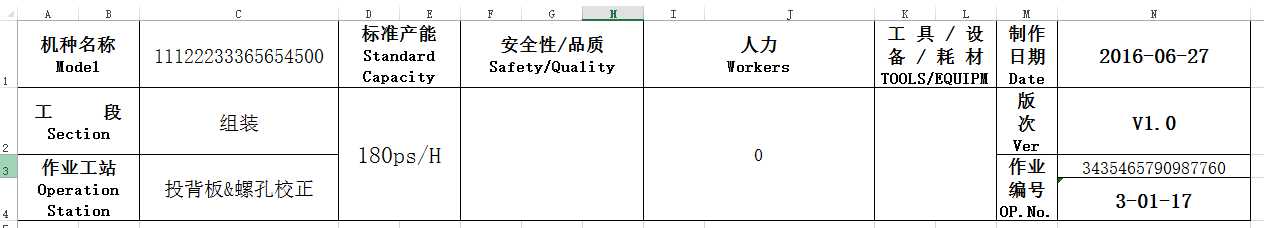
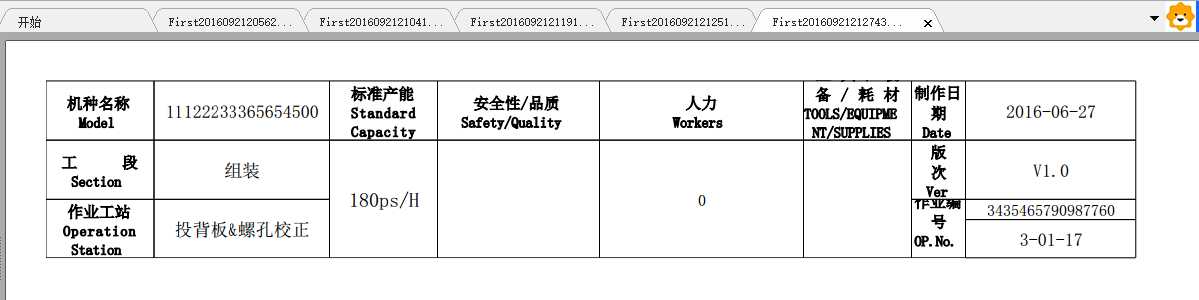
有些情况下,我们Excel里面有很多列,导致默认生成的pdf换行问题,这样将会导致PDF的可读性很差,这种情况,Spire.XLS为我们提供了自定义转换PDF的方式,比如可以指定PDF的页宽,页高,大小等等属性。
比如有如下Excel文档需要转换成PDF文件:
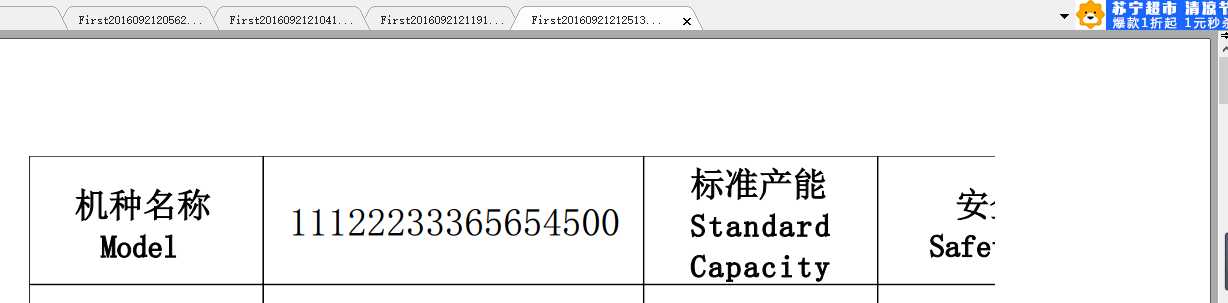
如果按照常规的转换,生成的PDF的宽度不足以显示Excel的所有列,于是转换出来的效果这样:
为了解决这种问题,组件为我们提供了如下方法:
        [HttpPost]
        public JsonResult UploadFile()
        {
            var strRes = string.Empty;
            var oFile = Request.Files["txt_file"];

            Workbook book = new Workbook();
            book.LoadFromStream(oFile.InputStream);
            var strFullName = @"D:\Data\Upload\" + "First" + DateTime.Now.ToString("yyyyMMddHHmmss") + ".pdf";
            PdfDocument pdfDocument = new PdfDocument();
            pdfDocument.PageSettings.Orientation = PdfPageOrientation.Landscape;
            pdfDocument.PageSettings.Width = 1800;//指定PDF的宽度
            pdfDocument.PageSettings.Height = 1000;//指定PDF的高度

            PdfConverterSettings settings = new PdfConverterSettings();
            settings.TemplateDocument = pdfDocument;

            PdfConverter pdfConverter = new PdfConverter(book);
            pdfDocument = pdfConverter.Convert(settings);
            pdfDocument.SaveToFile(strFullName);
            return Json(new object { }, JsonRequestBehavior.AllowGet);
        }
这样就可以正常了,如果你的Excel列更多,可以适当调整宽度和高度。得到的结果如下
还有更多强大的功能大家有兴趣可以慢慢探索,官方文档写得还算详细。
2.4、Excel转其他类型
除了转为PDF,Spire.XLS还支持转换为其他类型,比如常见的xml、Image、Html等。如果大家有这方面的需求,可以深究一下。
通过下面一张图先来看看Excel里面生成图表的原理
通过这张图我们可以看到,Excel生成图表首先需要当前文档里面存在数据表格,然后选中相应的数据表格,最后选择生成的图表类型,Excel应用会自动帮你生成相应的数据图表。
知道了上面Excel生成图表的原理,我们再来看看Spire.XLS组件如何帮助我们解决生成图表的问题。关于生成图表,Spire.XLS组件提供了很多的选择,覆盖了Excel里面各种自带的图表类型、统计方法等。下面先来看一个简单点的例子。
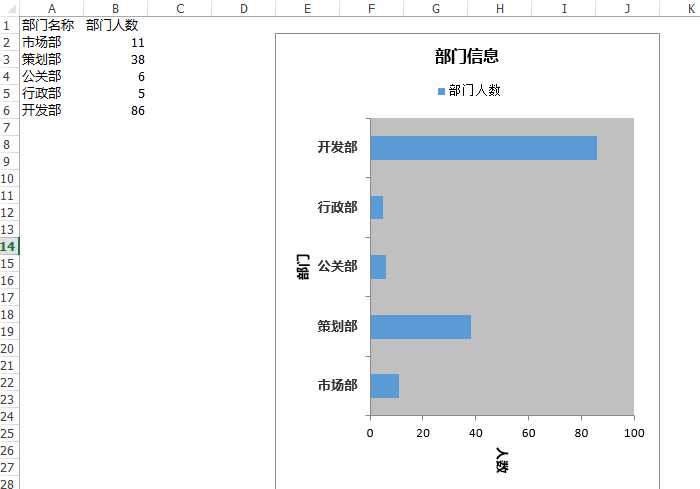
       [HttpPost]
        public JsonResult ExportData()
        {
            try
            {
                Workbook book = new Workbook();
                Worksheet sheet = book.Worksheets[0];
                var random = new Random();
                var iCellcount = 1;
                //1.设置表头
                sheet.Range[1, iCellcount++].Text = "部门名称";
                sheet.Range[1, iCellcount++].Text = "部门人数";
                var lstDeptName = new List<string>() { "市场部", "策划部", "公关部", "行政部", "开发部" };
                var a = 0;
                //2.构造表数据
                for (var i = 2; i < 7; i++)
                {
                    iCellcount = 1;
                    sheet.Range[i, iCellcount++].Text = lstDeptName[a++];
                    sheet.Range[i, iCellcount++].NumberValue = random.Next(1, 100); ;
                }
          //3.生成图表
                SetChart(sheet, ExcelChartType.BarClustered);var strFullName = @"D:\Data\Upload\" + "Export" + DateTime.Now.ToString("yyyyMMddHHmmss") + ".xlsx";
                book.SaveToFile(strFullName, ExcelVersion.Version2010);
            }
            catch (Exception ex)
            { }
            return Json(true, JsonRequestBehavior.AllowGet);
        }

        private void SetChart(Worksheet sheet, ExcelChartType chartFormat)
        {
            //1.设置sheet页的名称
            sheet.Name = "Chart data";
            sheet.GridLinesVisible = false;

            Chart chart = sheet.Charts.Add();

            //2.指定生成图表的区域
            chart.DataRange = sheet.Range["A1:B6"];
            chart.SeriesDataFromRange = false;

            //3.指定图表的所在位置
            chart.LeftColumn = 5;
            chart.TopRow = 2;
            chart.RightColumn = 11;
            chart.BottomRow = 29;
            chart.ChartType = chartFormat;

            //4.设置图表的名称以及x、y轴的名称
            chart.ChartTitle = "部门信息";
            chart.ChartTitleArea.IsBold = true;
            chart.ChartTitleArea.Size = 12;

            chart.PrimaryCategoryAxis.Title = "部门";
            chart.PrimaryCategoryAxis.Font.IsBold = true;
            chart.PrimaryCategoryAxis.TitleArea.IsBold = true;

            chart.PrimaryValueAxis.Title = "人数";
            chart.PrimaryValueAxis.HasMajorGridLines = false;
            chart.PrimaryValueAxis.TitleArea.TextRotationAngle = 90;
            chart.PrimaryValueAxis.MinValue = 0;
            chart.PrimaryValueAxis.TitleArea.IsBold = true;

            //5.设置图表的值
            Spire.Xls.Charts.ChartSerie cs = chart.Series[0];
            cs.CategoryLabels = sheet.Range["A2:A6"];
            cs.Values = sheet.Range["B2:B6"];
            cs.DataFormat.ShowActiveValue = true;
            chart.Legend.Position = LegendPositionType.Top;
        }
通过以上一段代码得到的Excel内容如下:
代码释疑:关于上面的代码不难,但还是想做些简单的说明。
Spire.Xls.Charts.ChartSerie cs = chart.Series[0];
cs.CategoryLabels = sheet.Range["A2:A6"];
cs.Values = sheet.Range["B2:B6"];
这种方式去指定分类和值的区域,更加符合Excel的操作习惯。当然,如无特殊,这些完全可以不用指定。
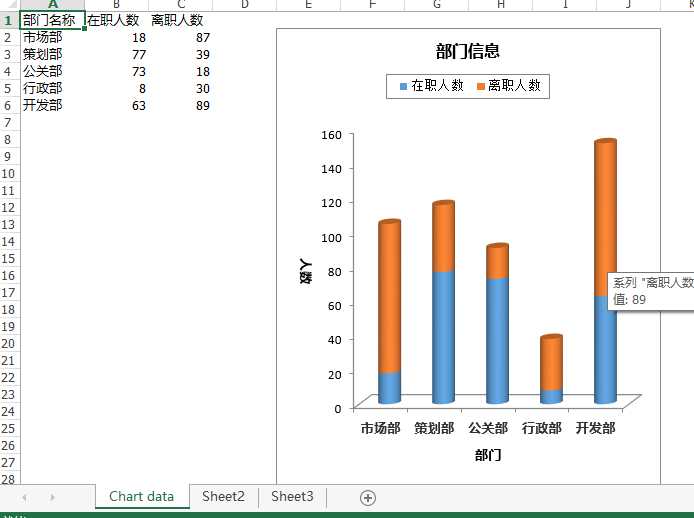
上面只是一个最简单的例子,如果要对多列进行统计呢?我们继续来看这个例子,我们将代码改成这样:
     [HttpPost]
        public JsonResult ExportData()
        {
            try
            {
                Workbook book = new Workbook();
                Worksheet sheet = book.Worksheets[0];
                var random = new Random();
                var iCellcount = 1;
                //1.设置表头
                sheet.Range[1, iCellcount++].Text = "部门名称";
                sheet.Range[1, iCellcount++].Text = "在职人数";
                sheet.Range[1, iCellcount++].Text = "离职人数";
                var lstDeptName = new List<string>() { "市场部", "策划部", "公关部", "行政部", "开发部" };
                var a = 0;
                //2.构造表数据
                for (var i = 2; i < 7; i++)
                {
                    iCellcount = 1;
                    sheet.Range[i, iCellcount++].Text = lstDeptName[a++];
                    sheet.Range[i, iCellcount++].NumberValue = random.Next(1, 100);
                    sheet.Range[i, iCellcount++].NumberValue = random.Next(1, 100); ;
                }
//3.生成图表
                SetChart(sheet, ExcelChartType.BarClustered);
                var strFullName = @"D:\Data\Upload\" + "Export" + DateTime.Now.ToString("yyyyMMddHHmmss") + ".xlsx";
                book.SaveToFile(strFullName, ExcelVersion.Version2010);
            }
            catch (Exception ex){}
            return Json(true, JsonRequestBehavior.AllowGet);
        }

        private void SetChart(Worksheet sheet, ExcelChartType chartFormat)
        {
            //1.设置sheet页的名称
            sheet.Name = "Chart data";
            sheet.GridLinesVisible = false;

            Chart chart = sheet.Charts.Add();

            //2.指定生成图表的区域
            chart.DataRange = sheet.Range["A1:C6"];
            chart.SeriesDataFromRange = false;

            //3.指定图表的所在位置
            chart.LeftColumn = 5;
            chart.TopRow = 2;
            chart.RightColumn = 11;
            chart.BottomRow = 29;
            chart.ChartType = chartFormat;

            //4.设置图表的名称以及x、y轴的名称
            chart.ChartTitle = "部门信息";
            chart.ChartTitleArea.IsBold = true;
            chart.ChartTitleArea.Size = 12;

            chart.PrimaryCategoryAxis.Title = "部门";
            chart.PrimaryCategoryAxis.Font.IsBold = true;
            chart.PrimaryCategoryAxis.TitleArea.IsBold = true;

            chart.PrimaryValueAxis.Title = "人数";
            chart.PrimaryValueAxis.HasMajorGridLines = false;
            chart.PrimaryValueAxis.TitleArea.TextRotationAngle = 90;
            chart.PrimaryValueAxis.MinValue = 0;
            chart.PrimaryValueAxis.TitleArea.IsBold = true;

            //5.设置图表的值
            Spire.Xls.Charts.ChartSerie cs = chart.Series[0];
            cs.DataFormat.ShowActiveValue = true;
            cs.DataFormat.ShowBubble = true;
            chart.Legend.Position = LegendPositionType.Top;

        }
得到结果如下:
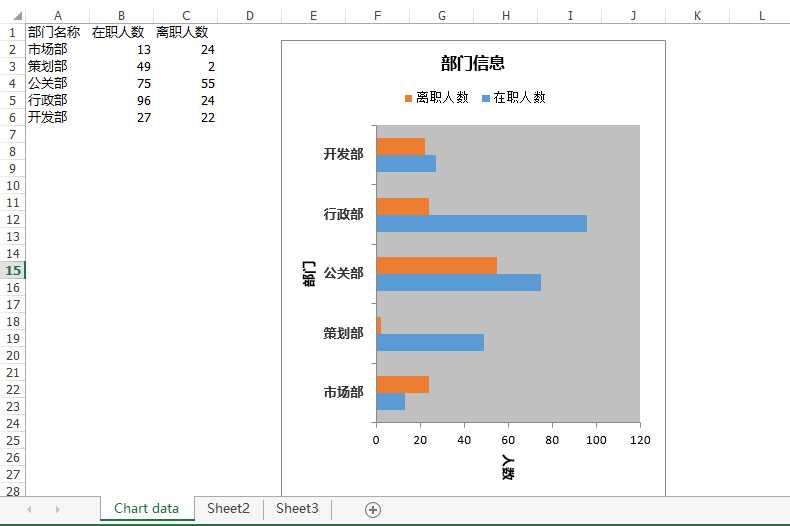
这里唯一的变化是数据区域,只要指定我们需要生成图表的区域是哪部分,Excel会自动进行计算并生成图表。
上文说过, chart.ChartType = chartFormat; 这一句可以设置图表的类型,在Spire.XLS里面定义了一系列的图表类型:

amespace Spire.Xls
{
    // 摘要:
    //     Chart types.
    public enum ExcelChartType
    {
        // 摘要:
        //     Represents the column clustered chart type.
        ColumnClustered = 0,
        //
        // 摘要:
        //     Represents the stacked column chart type.
        ColumnStacked = 1,
        //
        // 摘要:
        //     Represents the 100% stacked column chart type.
        Column100PercentStacked = 2,
        //
        // 摘要:
        //     Represents the 3D clustered column chart type.
        Column3DClustered = 3,
        //
        // 摘要:
        //     Represents the 3D stacked column chart type.
        Column3DStacked = 4,
        //
        // 摘要:
        //     Represents the 3D 100% stacked column chart type.
        Column3D100PercentStacked = 5,
        //
        // 摘要:
        //     Represents the 3D column chart type.
        Column3D = 6,
        //
        // 摘要:
        //     Represents the clustered bar chart type.
        BarClustered = 7,
        //
        // 摘要:
        //     Represents the stacked bar chart type.
        BarStacked = 8,
        //
        // 摘要:
        //     Represents the 100% stacked bar chart type.
        Bar100PercentStacked = 9,
        //
        // 摘要:
        //     Represents the 3D clustered bar chart type.
        Bar3DClustered = 10,
        //
        // 摘要:
        //     Represents the 3D stacked bar chart type.
        Bar3DStacked = 11,
        //
        // 摘要:
        //     Represents the 100% 3D stacked bar chart type.
        Bar3D100PercentStacked = 12,
        //
        // 摘要:
        //     Represents the Line chart type.
        Line = 13,
        //
        // 摘要:
        //     Represents the stacked line chart type.
        LineStacked = 14,
        //
        // 摘要:
        //     Represents the 100% stacked line chart type.
        Line100PercentStacked = 15,
        //
        // 摘要:
        //     Represents the markers line chart type.
        LineMarkers = 16,
        //
        // 摘要:
        //     Represents the stacked markers line chart type.
        LineMarkersStacked = 17,
        //
        // 摘要:
        //     Represents the 100% stacked markers line chart type.
        LineMarkers100PercentStacked = 18,
        //
        // 摘要:
        //     Represents the 3D line chart type.
        Line3D = 19,
        //
        // 摘要:
        //     Represents the pie chart type.
        Pie = 20,
        //
        // 摘要:
        //     Represents the 3D pie chart type.
        Pie3D = 21,
        //
        // 摘要:
        //     Represents the pie of pie chart type.
        PieOfPie = 22,
        //
        // 摘要:
        //     Represents the exploded pie chart type.
        PieExploded = 23,
        //
        // 摘要:
        //     Represents the 3D exploded pie chart type.
        Pie3DExploded = 24,
        //
        // 摘要:
        //     Represents the bar pie chart type.
        PieBar = 25,
        //
        // 摘要:
        //     Represents the markers scatter chart type.
        ScatterMarkers = 26,
        //
        // 摘要:
        //     Represents the ScatterSmoothedLineMarkers chart type.
        ScatterSmoothedLineMarkers = 27,
        //
        // 摘要:
        //     Represents the ScatterSmoothedLine chart type.
        ScatterSmoothedLine = 28,
        //
        // 摘要:
        //     Represents the ScatterLineMarkers chart type.
        ScatterLineMarkers = 29,
        //
        // 摘要:
        //     Represents the ScatterLine chart type.
        ScatterLine = 30,
        //
        // 摘要:
        //     Represents the Area chart type.
        Area = 31,
        //
        // 摘要:
        //     Represents the AreaStacked chart type.
        AreaStacked = 32,
        //
        // 摘要:
        //     Represents the Area100PercentStacked chart type.
        Area100PercentStacked = 33,
        //
        // 摘要:
        //     Represents the Area3D chart type.
        Area3D = 34,
        //
        // 摘要:
        //     Represents the Area3DStacked chart type.
        Area3DStacked = 35,
        //
        // 摘要:
        //     Represents the Area3D100PercentStacked chart type.
        Area3D100PercentStacked = 36,
        //
        // 摘要:
        //     Represents the Doughnut chart type.
        Doughnut = 37,
        //
        // 摘要:
        //     Represents the DoughnutExploded chart type.
        DoughnutExploded = 38,
        //
        // 摘要:
        //     Represents the Radar chart type.
        Radar = 39,
        //
        // 摘要:
        //     Represents the RadarMarkers chart type.
        RadarMarkers = 40,
        //
        // 摘要:
        //     Represents the RadarFilled chart type.
        RadarFilled = 41,
        //
        // 摘要:
        //     Represents the Surface3D chart type.
        Surface3D = 42,
        //
        // 摘要:
        //     Represents the Surface3DNoColor chart type.
        Surface3DNoColor = 43,
        //
        // 摘要:
        //     Represents the SurfaceContour chart type.
        SurfaceContour = 44,
        //
        // 摘要:
        //     Represents the SurfaceContourNoColor chart type.
        SurfaceContourNoColor = 45,
        //
        // 摘要:
        //     Represents the Bubble chart type.
        Bubble = 46,
        //
        // 摘要:
        //     Represents the Bubble3D chart type.
        Bubble3D = 47,
        //
        // 摘要:
        //     Represents the StockHighLowClose chart type.
        StockHighLowClose = 48,
        //
        // 摘要:
        //     Represents the StockOpenHighLowClose chart type.
        StockOpenHighLowClose = 49,
        //
        // 摘要:
        //     Represents the StockVolumeHighLowClose chart type.
        StockVolumeHighLowClose = 50,
        //
        // 摘要:
        //     Represents the StockVolumeOpenHighLowClose chart type.
        StockVolumeOpenHighLowClose = 51,
        //
        // 摘要:
        //     Represents the CylinderClustered chart type.
        CylinderClustered = 52,
        //
        // 摘要:
        //     Represents the CylinderStacked chart type.
        CylinderStacked = 53,
        //
        // 摘要:
        //     Represents the Cylinder100PercentStacked chart type.
        Cylinder100PercentStacked = 54,
        //
        // 摘要:
        //     Represents the CylinderBarClustered chart type.
        CylinderBarClustered = 55,
        //
        // 摘要:
        //     Represents the CylinderBarStacked chart type.
        CylinderBarStacked = 56,
        //
        // 摘要:
        //     Represents the CylinderBar100PercentStacked chart type.
        CylinderBar100PercentStacked = 57,
        //
        // 摘要:
        //     Represents the Cylinder3DClustered chart type.
        Cylinder3DClustered = 58,
        //
        // 摘要:
        //     Represents the ConeClustered chart type.
        ConeClustered = 59,
        //
        // 摘要:
        //     Represents the ConeStacked chart type.
        ConeStacked = 60,
        //
        // 摘要:
        //     Represents the Cone100PercentStacked chart type.
        Cone100PercentStacked = 61,
        //
        // 摘要:
        //     Represents the ConeBarClustered chart type.
        ConeBarClustered = 62,
        //
        // 摘要:
        //     Represents the ConeBarStacked chart type.
        ConeBarStacked = 63,
        //
        // 摘要:
        //     Represents the ConeBar100PercentStacked chart type.
        ConeBar100PercentStacked = 64,
        //
        // 摘要:
        //     Represents the Cone3DClustered chart type.
        Cone3DClustered = 65,
        //
        // 摘要:
        //     Represents the PyramidClustered chart type.
        PyramidClustered = 66,
        //
        // 摘要:
        //     Represents the PyramidStacked chart type.
        PyramidStacked = 67,
        //
        // 摘要:
        //     Represents the Pyramid100PercentStacked chart type.
        Pyramid100PercentStacked = 68,
        //
        // 摘要:
        //     Represents the PyramidBarClustered chart type.
        PyramidBarClustered = 69,
        //
        // 摘要:
        //     Represents the PyramidBarStacked chart type.
        PyramidBarStacked = 70,
        //
        // 摘要:
        //     Represents the PyramidBar100PercentStacked chart type.
        PyramidBar100PercentStacked = 71,
        //
        // 摘要:
        //     Represents the Pyramid3DClustered chart type.
        Pyramid3DClustered = 72,
        //
        // 摘要:
        //     Represents the CombinationChart chart types.
        CombinationChart = 73,
    }
}
我们来看看一些比较常见的图表
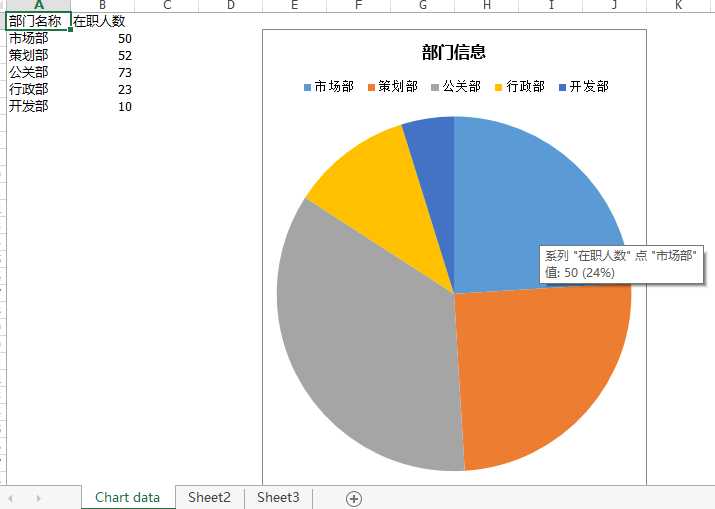
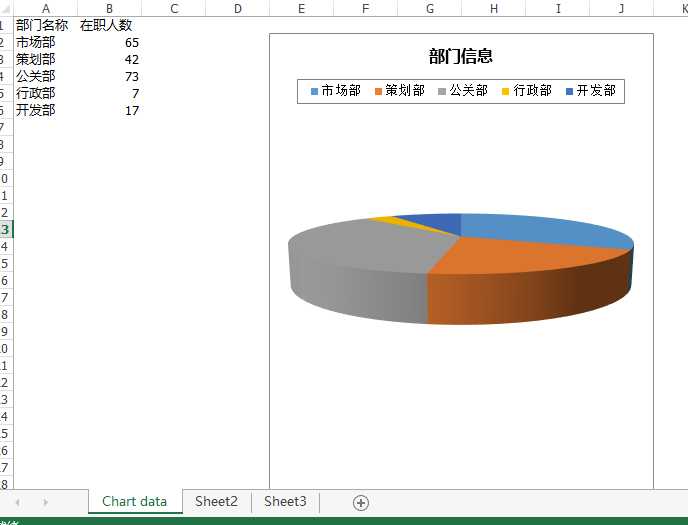
2.4.1、饼状图
ExcelChartType.Pie
ExcelChartType.Pie3D
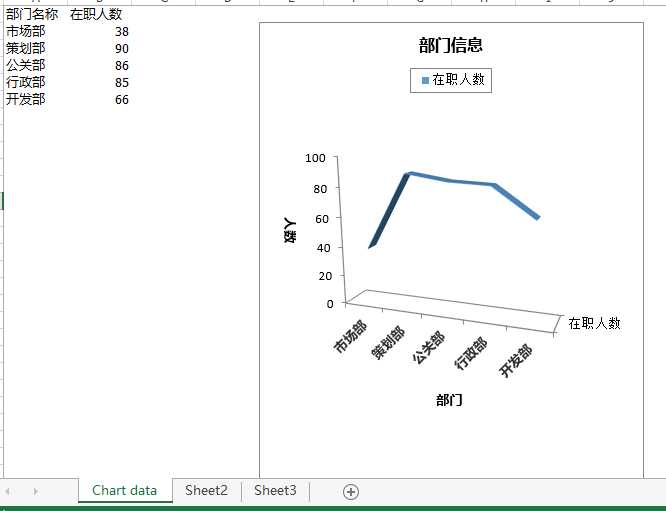
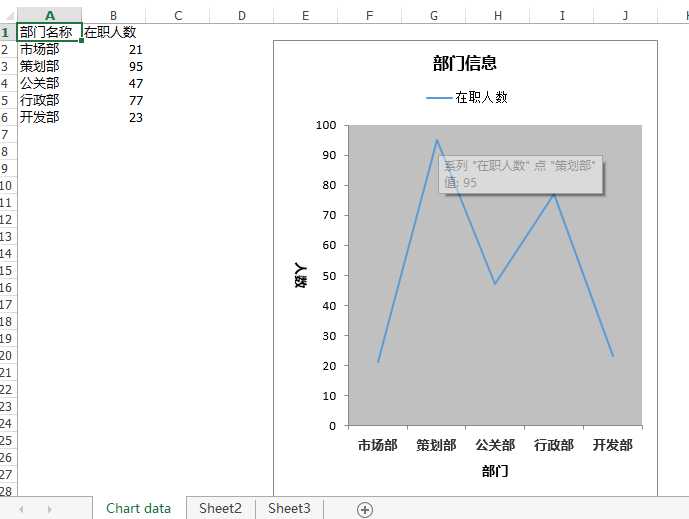
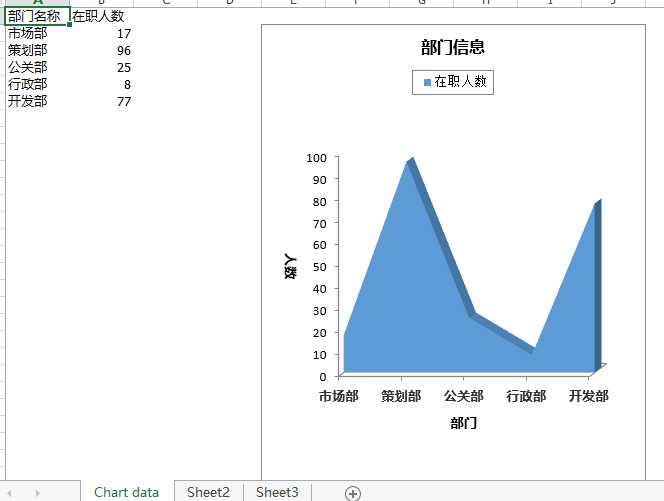
2.4.2、连线图
ExcelChartType.Line3D
ExcelChartType.LineStacked
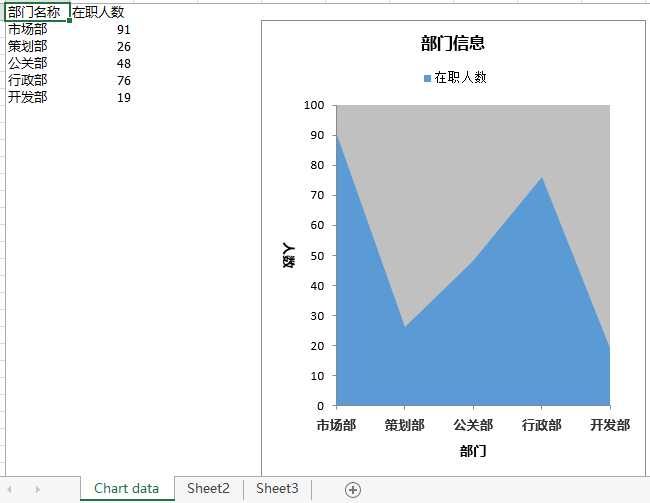
2.4.3、区域图
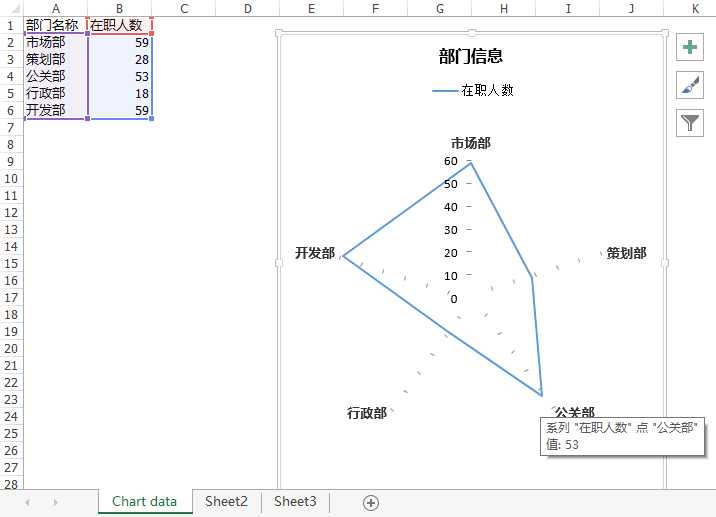
2.4.4、雷达图
2.4.5、圆形柱状图
关于Spire.XLS的其他亮点功能,博主也还在研究,已经知道的一些常用功能比如(1)支持单元格合并、冻结、注释;(2)数据库方式的导入导出;(3)Sheet页的复制、切割、显示、隐藏等;(4)页眉页脚的设置;(5)数据的分组、排序;(6)像Excel插入图片,设置图片样式等。这些功能有些已经实现,有些还在研究,等以后有机会再发出来供大家参考。因为篇幅问题,这篇先到这里吧。更多功能可以查看下篇http://www.cnblogs.com/landeanfen/p/5906077.html
以上简单总结了下Spire.XLS组件几个特色功能,很好的解决了博主遇到的问题,博主觉得在一定程度上,Spire.XLS组件能拟补NPOI、COM组件的部分不足。还有很多其他特色功能待以后整理之后连带测试Demo一起发出。如果你也遇到一些其他组件解决不了的问题,不妨试试它,或许会带给你惊喜。当然,如果本文能够帮到你,还是希望园友们帮忙推荐,博主下次继续努力!
本文原创出处:http://www.cnblogs.com/landeanfen/
欢迎各位转载,但是未经作者本人同意,转载文章之后必须在文章页面明显位置给出作者和原文连接,否则保留追究法律责任的权利
出处:http://www.cnblogs.com/landeanfen/p/5888973.html
C#组件系列——又一款Excel处理神器Spire.XLS,你值得拥有(一)
标签:homepage blog 上传控件 注释 项目 getpath 文件路径 复制 grid
原文地址:http://www.cnblogs.com/mq0036/p/6044935.html
