标签:his height image plot draw http number str lin

 1 from matplotlib import pyplot as plt
 2
 3 # 参数依次为list,抬头,X轴标签,Y轴标签,XY轴的范围
 4 def draw_hist(myList,Title,Xlabel,Ylabel,Xmin,Xmax,Ymin,Ymax):
 5     plt.hist(myList,100)
 6     plt.xlabel(Xlabel)
 7     plt.xlim(Xmin,Xmax)
 8     plt.ylabel(Ylabel)
 9     plt.ylim(Ymin,Ymax)
10     plt.title(Title)
11     plt.show()
12
13
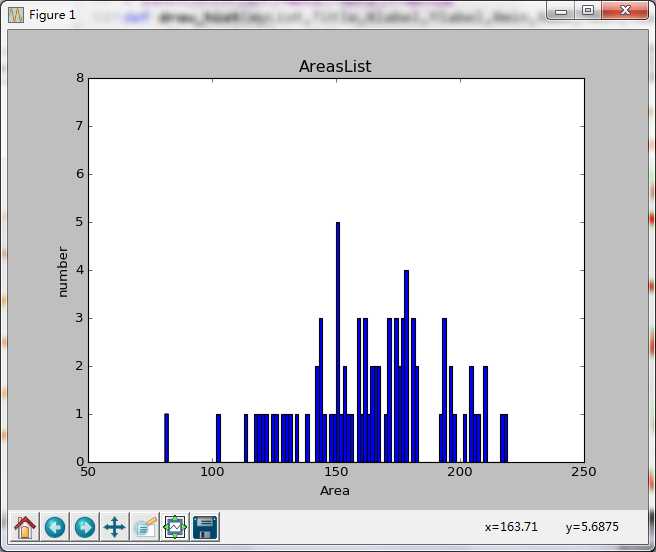
14 draw_hist(areaList,‘AreasList‘,‘Area‘,‘number‘,50.0,250,0.0,8)   # 直方图展示
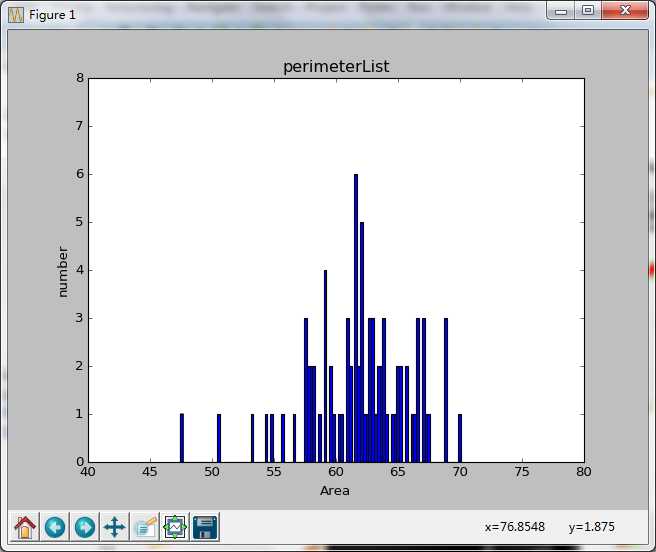
15 draw_hist(perimeterList,‘perimeterList‘,‘Area‘,‘number‘,40.0,80,0.0,8)
结果如下:


方便快捷,需要看一组数据的分布频数,就可以用以上的方法。
标签:his height image plot draw http number str lin
原文地址:http://www.cnblogs.com/jerrybaby/p/6118236.html