标签:rip box tac base sort lin find mon 1.0
由于工作需要,需要统计交易数据的TP50,TP90,TP95,TP99。采用的前端技术是jquery+json+echart。
一、TP定义(谷歌)
Calculating TP is very simple:
1. Sort all times in ascending order: [2s, 10s, 100s, 1000s]
2. find latest item in portion you need to calculate.
2.1 For TP50 it will be ceil(4*0.5) = 2 requests. You need 2nd request.
2.2 For TP90 it will be ceil(4*0.9) = 4. You need 4th request.
3. We get time for the item found above. TP50=10s. TP90=1000s
二、json数据结构
{
"2017-01-01": {
"tp50": {
"cost": 0.628
},
"tp90": {
"cost": 0.655
},
"tp95": {
"cost": 0.796
},
"tp99": {
"cost": 1.907
}
},
"2017-01-02": {
"tp50": {
"cost": 0.614
},
"tp90": {
"cost": 0.645
},
"tp95": {
"cost": 0.784
},
"tp99": {
"cost": 2.224
}
},
"2017-01-03": {
"tp50": {
"cost": 0.615
},
"tp90": {
"cost": 0.651
},
"tp95": {
"cost": 0.808
},
"tp99": {
"cost": 2.745
}
}
}
三、前端页面代码片段

1 <%@ page language="java" contentType="text/html; charset=UTF-8" pageEncoding="UTF-8"%> 2 <!DOCTYPE html PUBLIC "-//W3C//DTD HTML 4.01 Transitional//EN" "http://www.w3.org/TR/html4/loose.dtd"> 3 <html> 4 <head> 5 <meta http-equiv="Content-Type" content="text/html; charset=UTF-8"> 6 <title>tp</title> 7 <script src="js/echarts.js"></script> 8 <script src="js/jquery-3.1.1.min.js"></script> 9 <script language="javascript" type="text/javascript" src="My97DatePicker/WdatePicker.js"></script> 10 <script> 11 $(document).ready(function() { 12 $("button").click(function() { 13 var startDate = $("#startDate").val(); 14 var endDate = $("#endDate").val(); 15 $.getJSON({ 16 url : "/ipos-timer/getTpList", 17 data:"startDate="+startDate+"&endDate="+endDate, 18 success : function(data) { 19 myChart.setOption({ 20 xAxis : { 21 data : data.range 22 }, 23 series : [ { 24 name : ‘tp50‘, 25 data : data.tp50 26 }, { 27 name : ‘tp90‘, 28 data : data.tp90 29 }, { 30 name : ‘tp95‘, 31 data : data.tp95 32 }, { 33 name : ‘tp99‘, 34 data : data.tp99 35 } ] 36 }); 37 } 38 }); 39 }); 40 }); 41 </script> 42 </head> 43 <body> 44 start: 45 <input class="Wdate" id="startDate" type="text" onClick="WdatePicker()"> 46 end: 47 <input class="Wdate" id="endDate" type="text" onClick="WdatePicker()"> 48 <button>search</button> 49 <div id="main" style="width: 1200px; height: 400px;"></div> 50 <script> 51 var myChart = echarts.init(document.getElementById(‘main‘)); 52 option = { 53 tooltip : { 54 trigger : ‘axis‘ 55 }, 56 legend : { 57 data : [ ‘tp50‘, ‘tp90‘, ‘tp95‘, ‘tp99‘ ] 58 }, 59 toolbox : { 60 show : true, 61 feature : { 62 mark : { 63 show : true 64 }, 65 dataView : { 66 show : true, 67 readOnly : false 68 }, 69 dataZoom : { 70 show : true 71 }, 72 magicType : { 73 show : true, 74 type : [ ‘line‘, ‘bar‘, ‘stack‘, ‘tiled‘ ] 75 }, 76 restore : { 77 show : true 78 }, 79 saveAsImage : { 80 show : true 81 } 82 } 83 }, 84 dataZoom : { 85 show : true, 86 realtime : true, 87 start : 0, 88 end : 100 89 }, 90 calculable : true, 91 xAxis : [ { 92 type : ‘category‘, 93 boundaryGap : false, 94 data : [] 95 } ], 96 yAxis : [ { 97 type : ‘value‘ 98 } ], 99 series : [ { 100 name : ‘tp50‘, 101 type : ‘line‘, 102 stack : ‘总量‘, 103 data : [] 104 }, { 105 name : ‘tp90‘, 106 type : ‘line‘, 107 stack : ‘总量‘, 108 data : [] 109 }, { 110 name : ‘tp95‘, 111 type : ‘line‘, 112 stack : ‘总量‘, 113 data : [] 114 }, { 115 name : ‘tp99‘, 116 type : ‘line‘, 117 stack : ‘总量‘, 118 data : [] 119 } ] 120 }; 121 myChart.setOption(option); 122 </script> 123 </body> 124 </html>
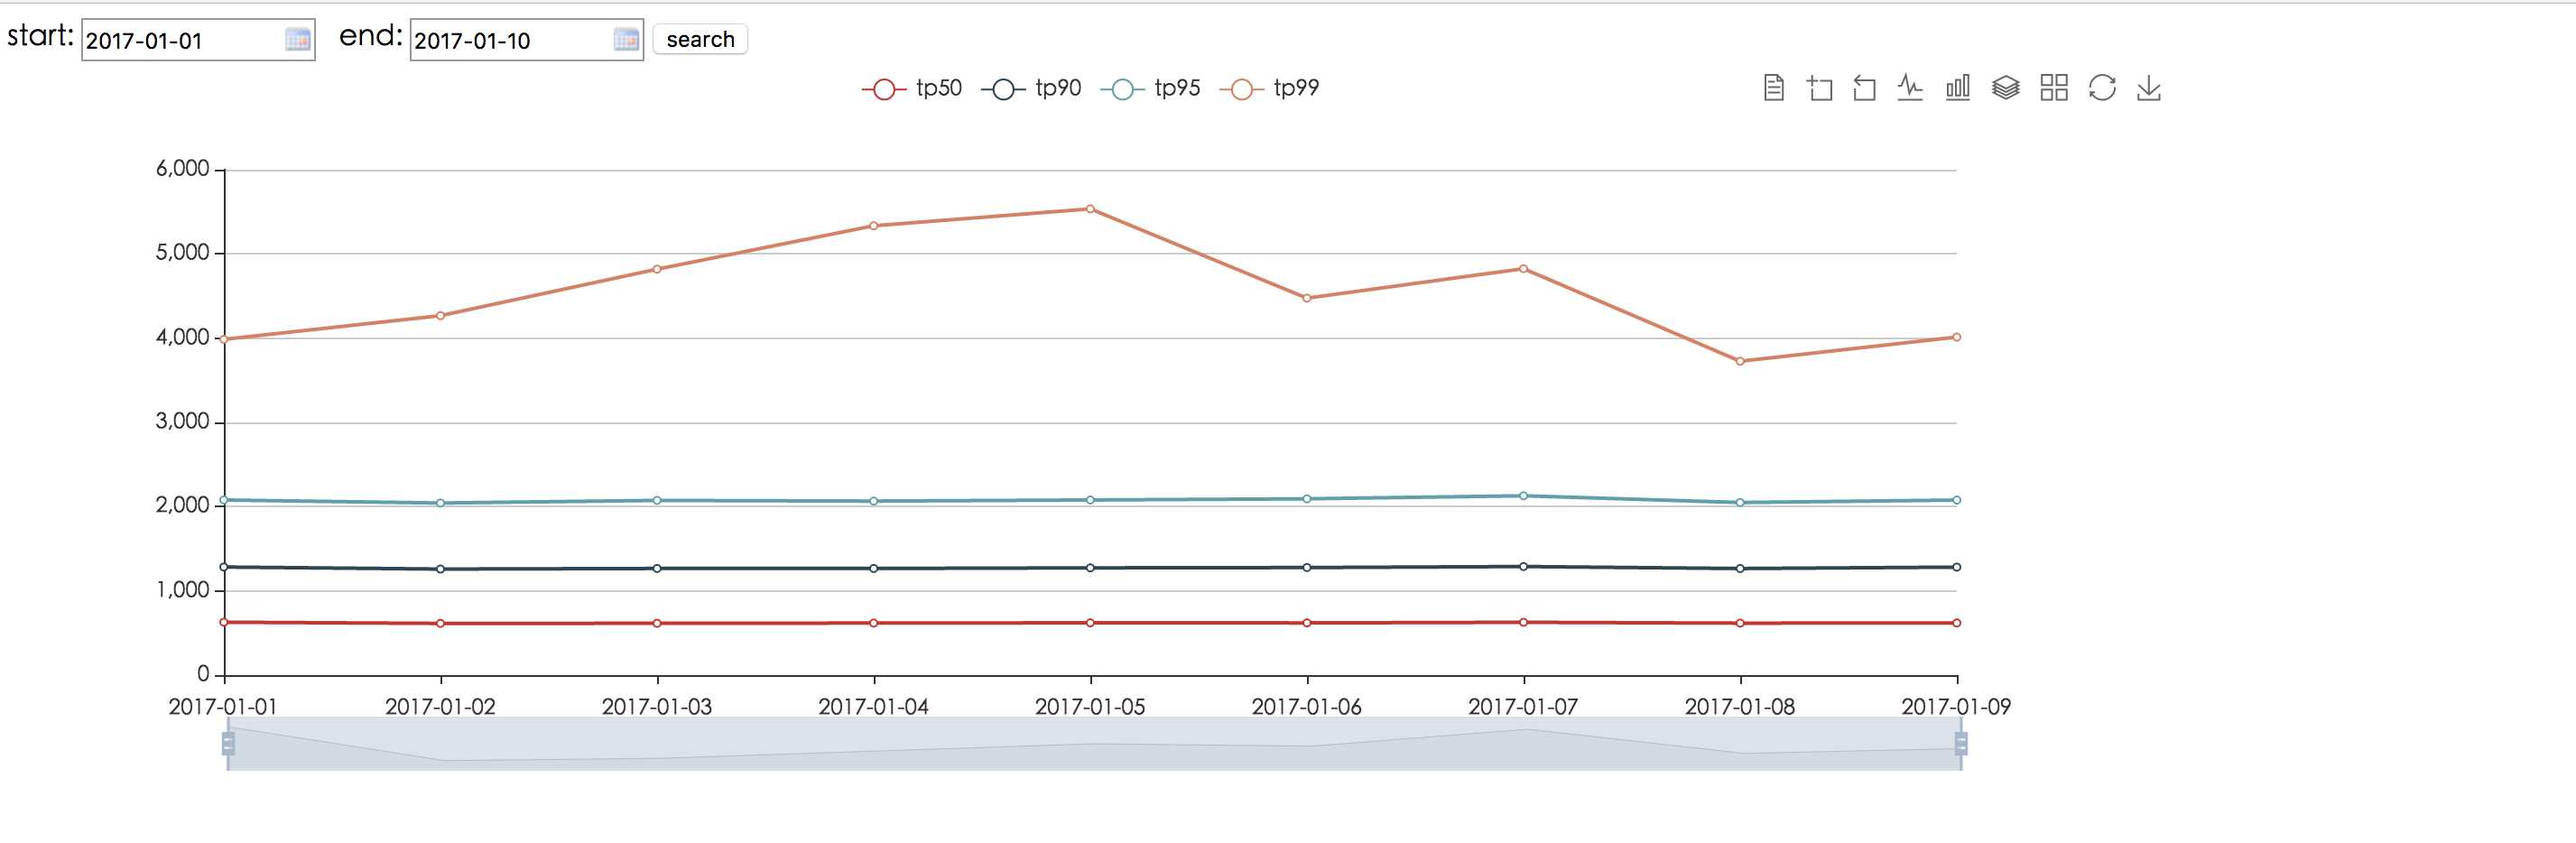
四、页面展示
标签:rip box tac base sort lin find mon 1.0
原文地址:http://www.cnblogs.com/cafebaber/p/6270361.html
