标签:linu nbsp lan orm mac os windows系统 open html debug
windows系统下主要的调试器:
| Platform | Compiler | Native Debugger |
|---|---|---|
| Linux | GCC/ICC | GDB, LLDB (experimental) |
| Unix | GCC/ICC | GDB |
| macOS | GCC/Clang | LLDB,FSF GDB(experimental) |
| Windows/MinGW | GCC | GDB |
| Windows/MSVC | Microsoft Visual C++ Compiler | Debugging Tools for Windows/CDB |
在qt的官方文档上,写明了各个平台上的qtcreator支持的编译器以及对应调试器。如windows平台上面MinGW版本的qtcreator就支持GDB调试器。而MSVC版本的qtcreator默认是没有调试器的,需要自己去安装并设置好调试器(CDB)。
下载地址:https://msdn.microsoft.com/zh-cn/library/windows/hardware/ff551063
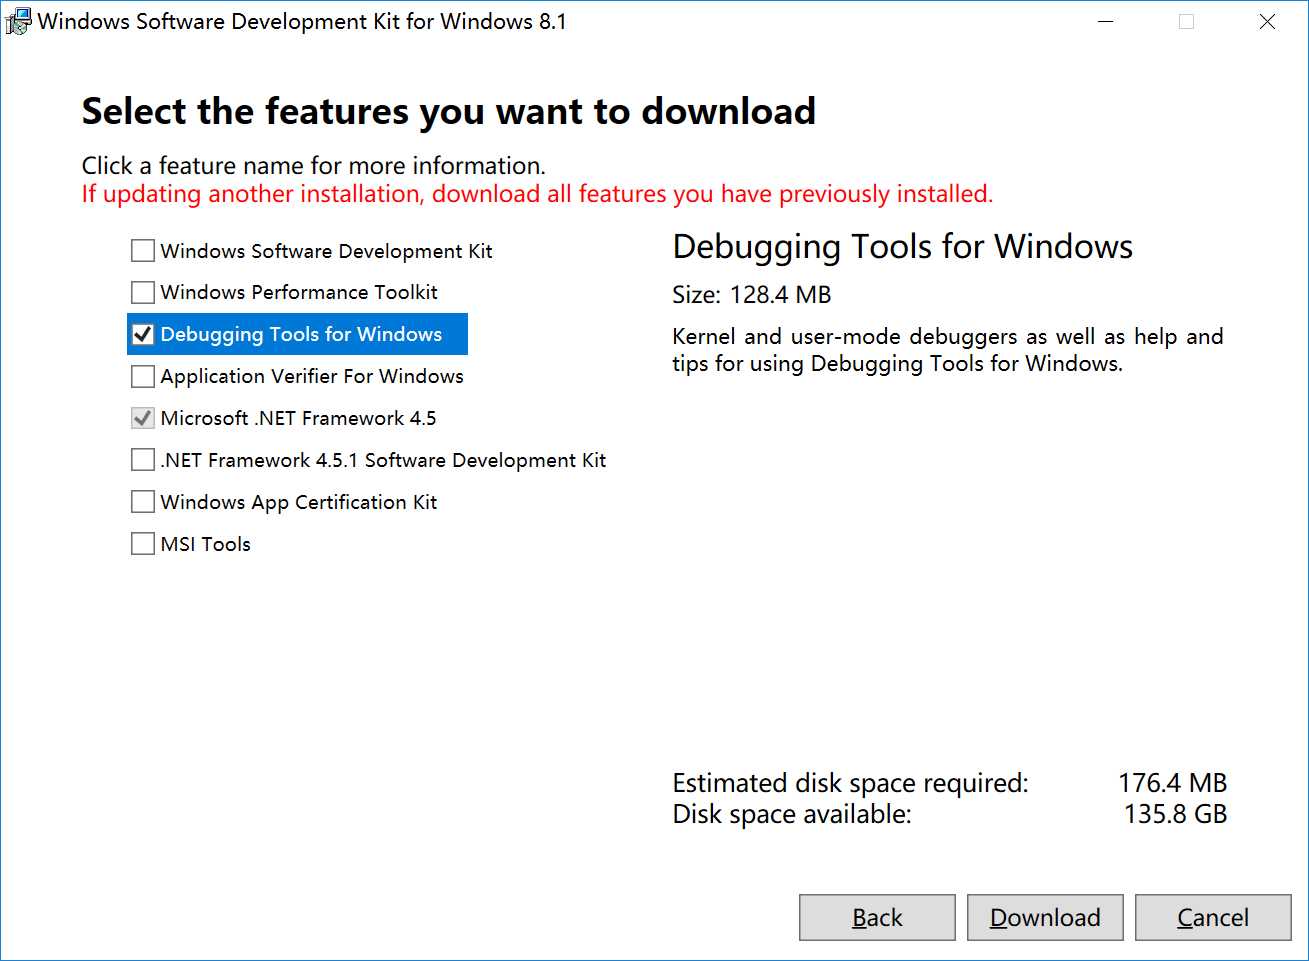
安装分为在线安装和离线安装,离线安装可以先选择将安装包下载下来,然后再安装。独立安装只选择Debugging Tools for Windows即可。
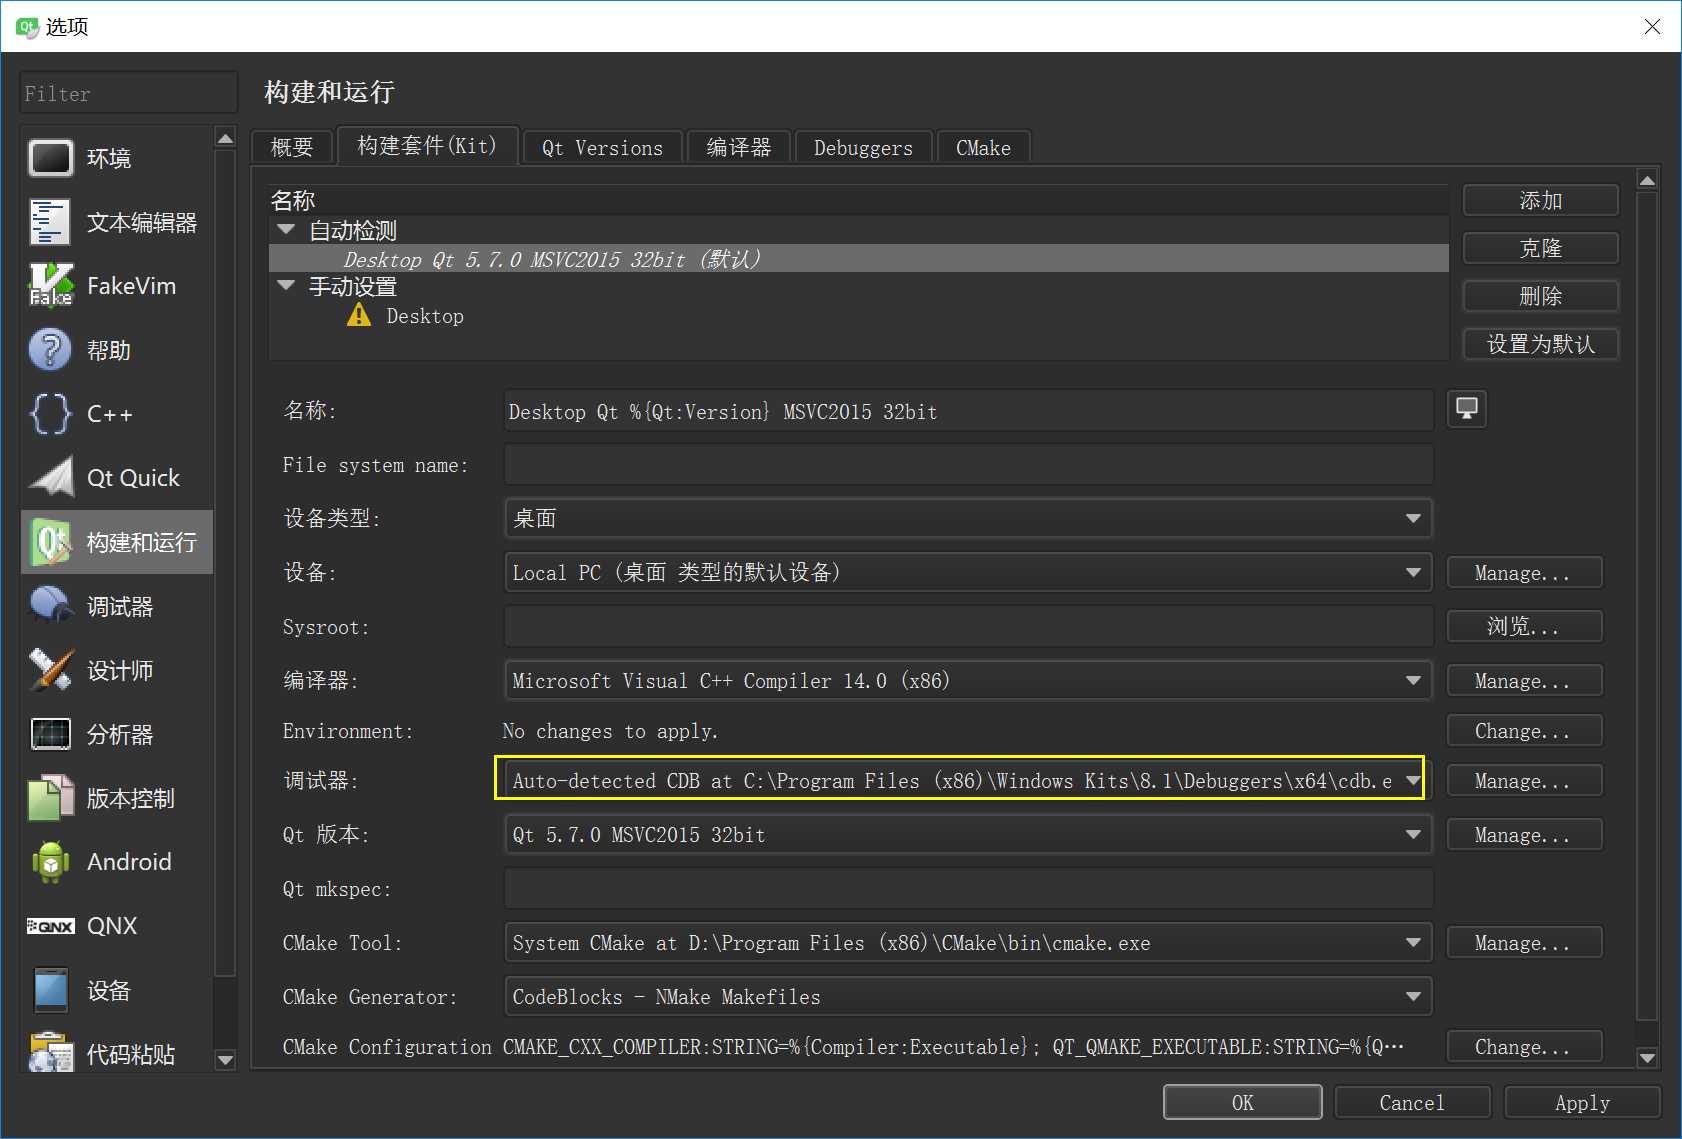
方式一: 手动配置
Tools >Options > Debugger> CDB PathsInsertC:\temp\symbolcache.OK.方式二:重启QtCreator,自动检测,然后手动选择调试器
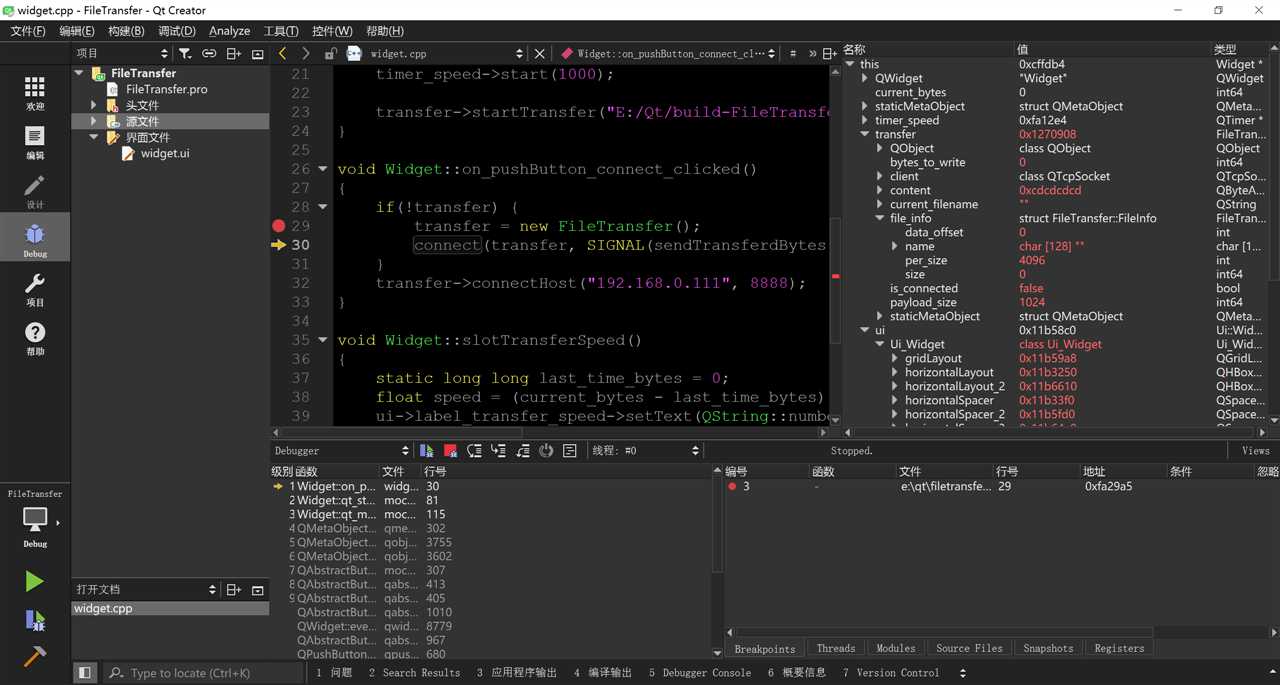
可以很清晰的看到变量的值变化,可以单步调试,打断点等等。
qt内存泄露检查:
https://wiki.qt.io/Profiling_and_Memory_Checking_Tools
http://www.voidcn.com/blog/u011012932/article/p-6231451.html
https://msdn.microsoft.com/zh-cn/library/windows/hardware/hh406277
https://doc.qt.io/qtcreator/creator-debugger-engines.html
http://blog.csdn.net/FreeApe/article/details/52976704
qt---cdb(Microsoft Console Debugger)调试
标签:linu nbsp lan orm mac os windows系统 open html debug
原文地址:http://www.cnblogs.com/findumars/p/6294101.html
