标签:https blog 技术 ati form images type 添加 参考
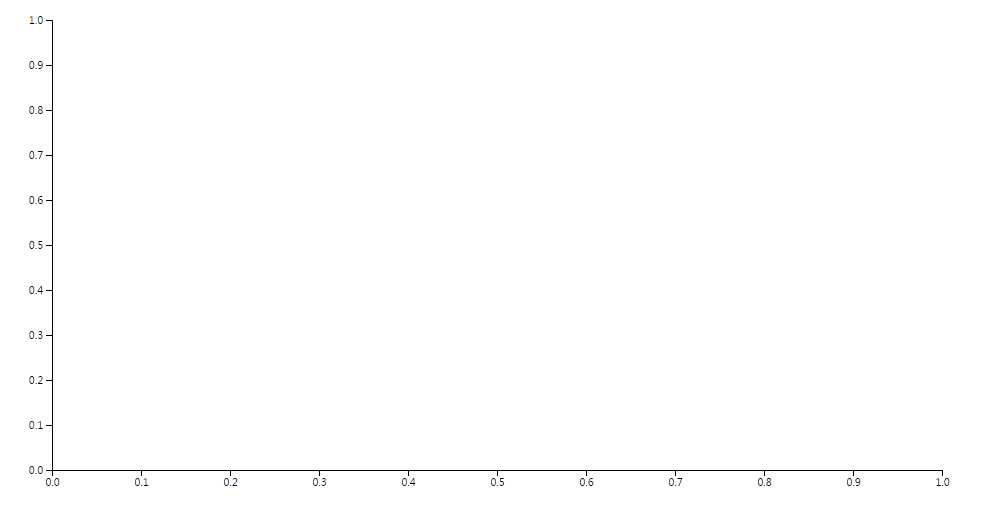
画坐标系,先上图,再先上代码。

<html>
<meta charset="utf-8">
<body></body>
<script src="https://d3js.org/d3.v4.min.js"></script>
<script type="text/javascript" src="circle.js"></script>
</html>
// 描述坐标系的背景的大小
var margin = {top: 20, right: 20, bottom: 30, left: 50},
    width = 960 - margin.left - margin.right,
    height = 500 - margin.top - margin.bottom;

//构造线性比例尺,默认域为[0,1]
//详细可参考 https://github.com/d3/d3/wiki/Quantitative-Scales#linear
var x = d3.scaleLinear().range([0, width]);
var y = d3.scaleLinear().range([height, 0]);

//定义背景---在body下添加并定义svg,在svg下添加并定义g幕布, transform是将这个对象相对移动,translate(平移)是移动方式,说明请参考https://github.com/d3/d3/wiki/%E6%95%B0%E5%AD%A6#transform_translate
var svg = d3.select("body").append("svg")
    .attr("width", width + margin.left + margin.right)
    .attr("height", height + margin.top + margin.bottom)
     .append("g")
    .attr("transform",
          "translate(" + margin.left + "," + margin.top + ")");

// 生成X轴
  svg.append("g")
      .attr("transform", "translate(0," + height + ")")
      .call(d3.axisBottom(x));

  // 生成Y轴
  svg.append("g")
      .call(d3.axisLeft(y));
标签:https blog 技术 ati form images type 添加 参考
原文地址:http://www.cnblogs.com/weihuan098/p/6713391.html