标签:utf-8 sci pytho pat cluster port marker append shape
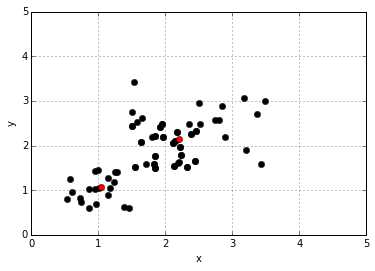
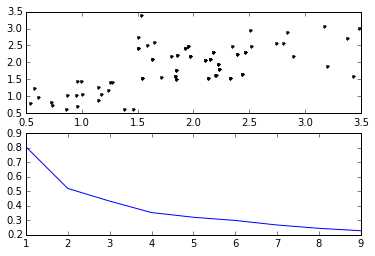
port  sys
reload(sys)
sys.setdefaultencoding(‘utf-8‘)

import matplotlib.pyplot as plt
import numpy as np

culster1 = np.random.uniform(0.5, 1.5, (2, 20))
culster2 = np.random.uniform(1.5, 2.5, (2, 20))
culster3 = np.random.uniform(1.5, 3.5, (2, 20))
culster4 = np.random.uniform(3.5, 4.5, (2, 20))

x1 = np.hstack((culster1,culster2))
x2 = np.hstack((culster2,culster3))
x = np.hstack((x1,x2)).T

plt.figure()
plt.axis([0, 5, 0, 5])
plt.xlabel(‘x‘)
plt.ylabel(‘y‘)
plt.grid(True)
plt.plot(x[:,0],x[:,1], ‘k.‘, markersize = 12)

from sklearn.cluster import KMeans
from scipy.spatial.distance import cdist

kmeans = KMeans(n_clusters = 2)
kmeans.fit(x)
plt.plot(kmeans.cluster_centers_[:,0],kmeans.cluster_centers_[:,1],‘ro‘)

K = range(1, 10)
meandistortions = []
for k in K:
    kmeans = KMeans(n_clusters=k)
    kmeans.fit(x)
    meandistortions.append(sum(np.min(cdist(x, kmeans.cluster_centers_,‘euclidean‘), axis=1)) / x.shape[0])#选择每行最小距离求和
plt.figure()
plt.grid(True)
plt1 = plt.subplot(2,1,1)
plt1.plot(x[:,0], x[:,1], ‘k.‘)
plt2 = plt.subplot(2,1,2)
plt2.plot(K, meandistortions)
标签:utf-8 sci pytho pat cluster port marker append shape
原文地址:http://www.cnblogs.com/Kermit-Li/p/6720271.html