标签:ges 不同 http title mat figure res 效果图 com
title 函数用来在一张图表上添加标题
基本用法:
main 表示主标题,通常位于图像的上方, sub 表示副标题,位于图像的下方, xlab 表示x轴的标签,ylab 表示y轴的标签
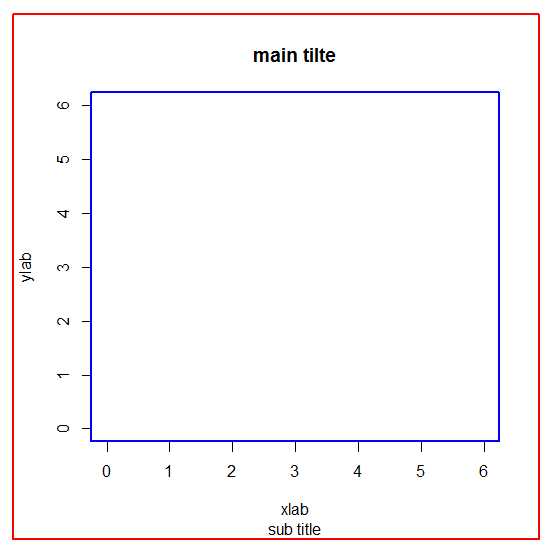
par(oma = c(1, 1, 1, 1))
plot(1:5, 1:5, xlim = c(0,6), ylim = c (0,6), type = "n", xlab = "", ylab = "")
box(which = "figure", col = "red", lwd = 2)
box(which = "plot", col = "blue", lwd = 2)
title(main = "main tilte", sub = "sub title", xlab = "xlab", ylab = "ylab")
效果图如下:
参数设置:
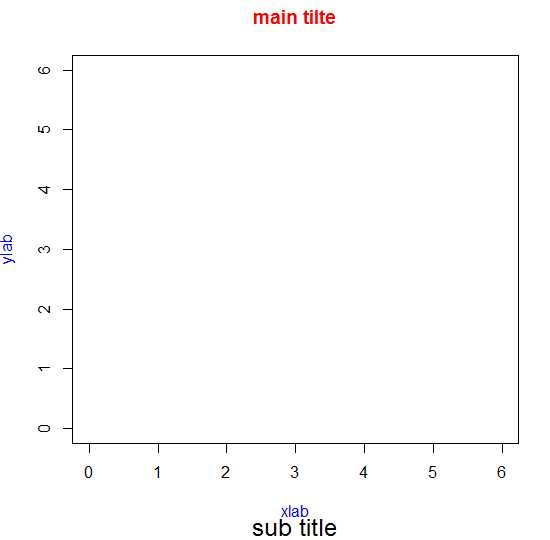
col : 设置标题的颜色
cex : 设置标题的文字大小
font : 设置标题的文字的格式
以上三个参数可以针对不同的标题分别进行设置,需要注意的是xlab和ylab 不能分开设置,只能是同时设置,对应的参数为 col.lab, col.cex, font.cex
代码示例:
plot(1:5, 1:5, xlim = c(0,6), ylim = c (0,6), type = "n", xlab = "", ylab = "")
title(main = "main tilte", sub = "sub title", xlab = "xlab", ylab = "ylab", col.main = "red", cex.sub = 1.5, col.lab = "blue")
效果图:
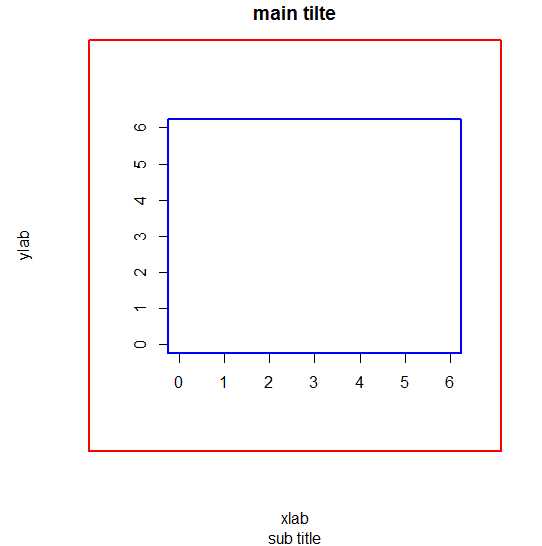
outer : 逻辑值,如果为TRUE, 将标题放到plot area的外边
代码示例:
par(oma = c(5, 5, 3, 3))
plot(1:5, 1:5, xlim = c(0,6), ylim = c (0,6), type = "n", xlab = "", ylab = "")
box(which = "figure", col = "red", lwd = 2)
box(which = "plot", col = "blue", lwd = 2)
title(main = "main tilte", sub = "sub title", xlab = "xlab", ylab = "ylab", outer=TRUE)
效果图如下:
title 中也允许表达式
代码示例:
plot(1:5, 1:5, xlim = c(0,6), ylim = c (0,6), type = "n", xlab = "", ylab = "")
title(main = expression(sqrt(x)), sub = expression(x^2), xlab = "xlab", ylab = "ylab")
效果图如下:
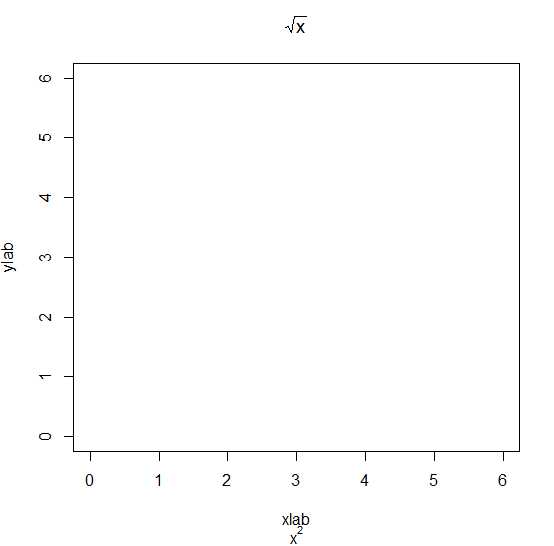
更多关于表达式的书写,可以参考plotmath 函数的帮助文档
标签:ges 不同 http title mat figure res 效果图 com
原文地址:http://www.cnblogs.com/xudongliang/p/6757195.html