标签:cat ext att continue axis values logs 列表 概率
GitHub:https://github.com/liqingwen2015/my_data_view
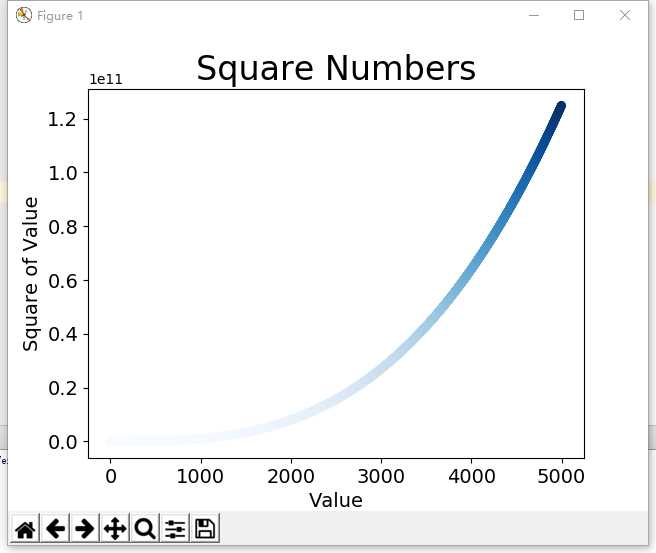
cube_squares.py
import matplotlib.pyplot as plt

x_values=list(range(1, 5000))
y_values=[pow(x, 3) for x in x_values]

plt.scatter(x_values, y_values, c=y_values, cmap=plt.cm.Blues, edgecolor=‘none‘, s=40)

# 设置标题和样式
plt.title("Square Numbers", fontsize=24)
plt.xlabel("Value", fontsize=14)
plt.ylabel("Square of Value", fontsize=14)

# 设置刻度标记的大小
plt.tick_params(axis=‘both‘, which=‘major‘, labelsize=14)

plt.show()
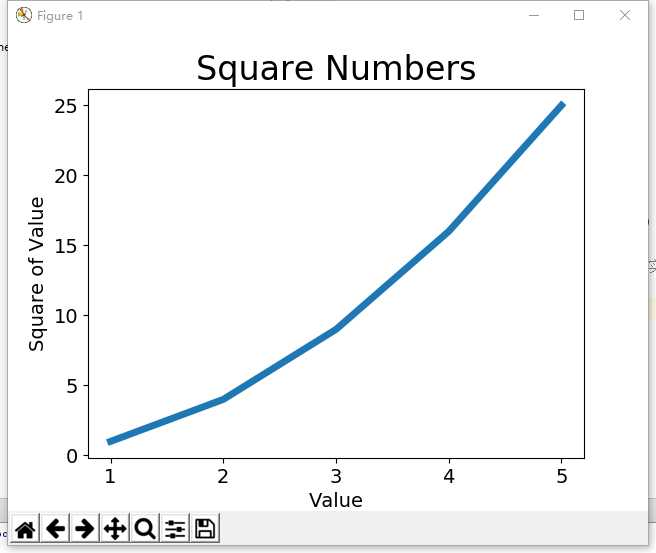
mpl_squares.py
# 简单的折线图
import matplotlib.pyplot as plt

input_values=[1, 2, 3, 4, 5 ]
squares = [1, 4, 9, 16, 25]

# 绘制线条的粗细
plt.plot(input_values, squares, linewidth=5)

# 设置图表标题,并给坐标轴加上标签
plt.title("Square Numbers", fontsize=24)
plt.xlabel("Value", fontsize=14)
plt.ylabel("Square of Value", fontsize=14)

# 设置刻度标记的大小,axis=‘both‘ 表示指定的实参影响 x 轴和 y 轴上的刻度
plt.tick_params(axis=‘both‘, labelsize=14)

plt.show()
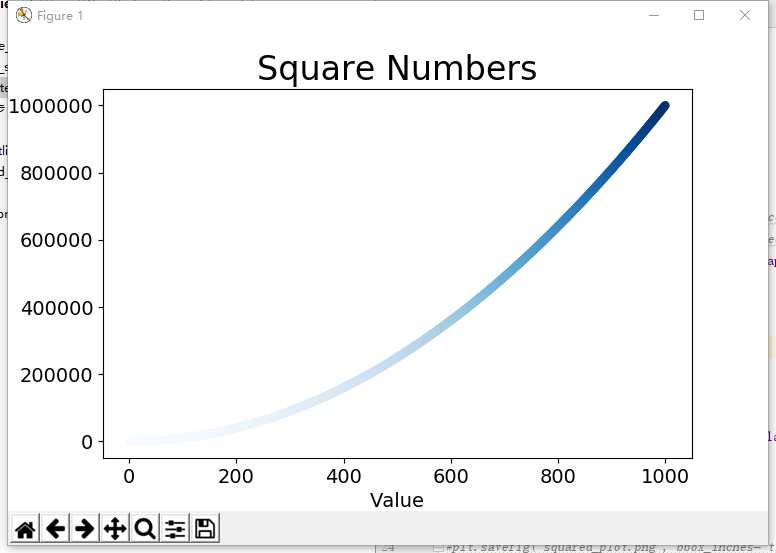
scatter_squares.py
# 散点图

import matplotlib.pyplot as plt

x_values = list(range(1, 1001))
y_values = [x**2 for x in x_values]

# c:颜色
#plt.scatter(x_values, y_values, c=‘red‘, edgecolor=‘none‘, s=40)
#plt.scatter(x_values, y_values, c=(0, 0, 8), edgecolor=‘none‘, s=40)
plt.scatter(x_values, y_values, c=y_values, cmap=plt.cm.Blues, edgecolor=‘none‘, s=40)

# 设置标题和样式
plt.title("Square Numbers", fontsize=24)
plt.xlabel("Value", fontsize=14)
plt.ylabel("Square of Value", fontsize=14)

# 设置刻度标记的大小
plt.tick_params(axis=‘both‘, which=‘major‘, labelsize=14)

plt.show()

# 保存图表
#plt.savefig(‘squared_plot.png‘, bbox_inches=‘tight‘)
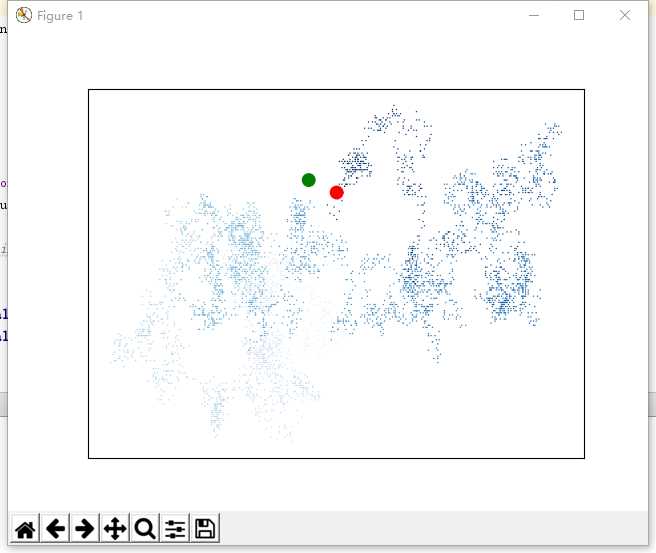
random_walk.py
from random import choice

class RandomWalk():

    def __init__(self, num_points=5000):
        # 初始化随机漫步的属性
        self.num_points = num_points

        # 所有随机漫步都始于(0, 0)
        self.x_values = [0]
        self.y_values = [0]

    def fill_walk(self):

        # 不断漫步,直到列表达到指定的长度
        while len(self.x_values) < self.num_points:
            x_step = self.get_step();
            y_step = self.get_step();

            # 拒绝原地踏步
            if x_step == 0 and y_step == 0:
                continue

            # 计算下一个点的 x 和 y 值
            next_x = self.x_values[-1] + x_step
            next_y = self.y_values[-1] + y_step

            self.x_values.append(next_x)
            self.y_values.append(next_y)

    def get_step(self):
        # 决定前进方向以及沿这个方向前进的距离
        direction = choice([1, -1])  # 随机选 1 或 -1
        distance = choice([0, 1, 2, 3, 4])  # 随机选 0, 1, 2, 3, 4

        return direction * distance  # 正数:右移,负数:左移
rw_visual.py
import matplotlib.pyplot as plt

from 随机漫步.random_walk import RandomWalk

while True:
    # 创建一个 RandomWalk 实例,并将其包含的点都绘制出来
    rw = RandomWalk(5000)
    rw.fill_walk()

    point_numbers = list(range(rw.num_points))
    plt.scatter(rw.x_values, rw.y_values, c=point_numbers, cmap=plt.cm.Blues, edgecolors=‘none‘, s=1)

    # 设置绘图窗口的尺寸
    #plt.figure(dpi=128, figsize=(10, 6))

    # 突出起点和终点
    plt.scatter(0, 0, c=‘green‘, edgecolors=‘none‘, s=100)
    plt.scatter(rw.x_values[-1], rw.y_values[-1], c=‘red‘, edgecolors=‘none‘, s=100)

    #plt.plot(rw.x_values, rw.y_values, linewidth=10)

    # 隐藏坐标轴
    plt.axes().get_xaxis().set_visible(False)
    plt.axes().get_yaxis().set_visible(False)

    plt.show()

    keep_running = input("继续?(y/n):")
    if keep_running == ‘n‘:
        break
die.py
from random import randint

class Die():
    # 表示一个骰子类

    def __init__(self, num_sides=6):
        # 6 面
        self.num_sides = num_sides

    def roll(self):
        # 返回 1~6
        return randint(1, self.num_sides)
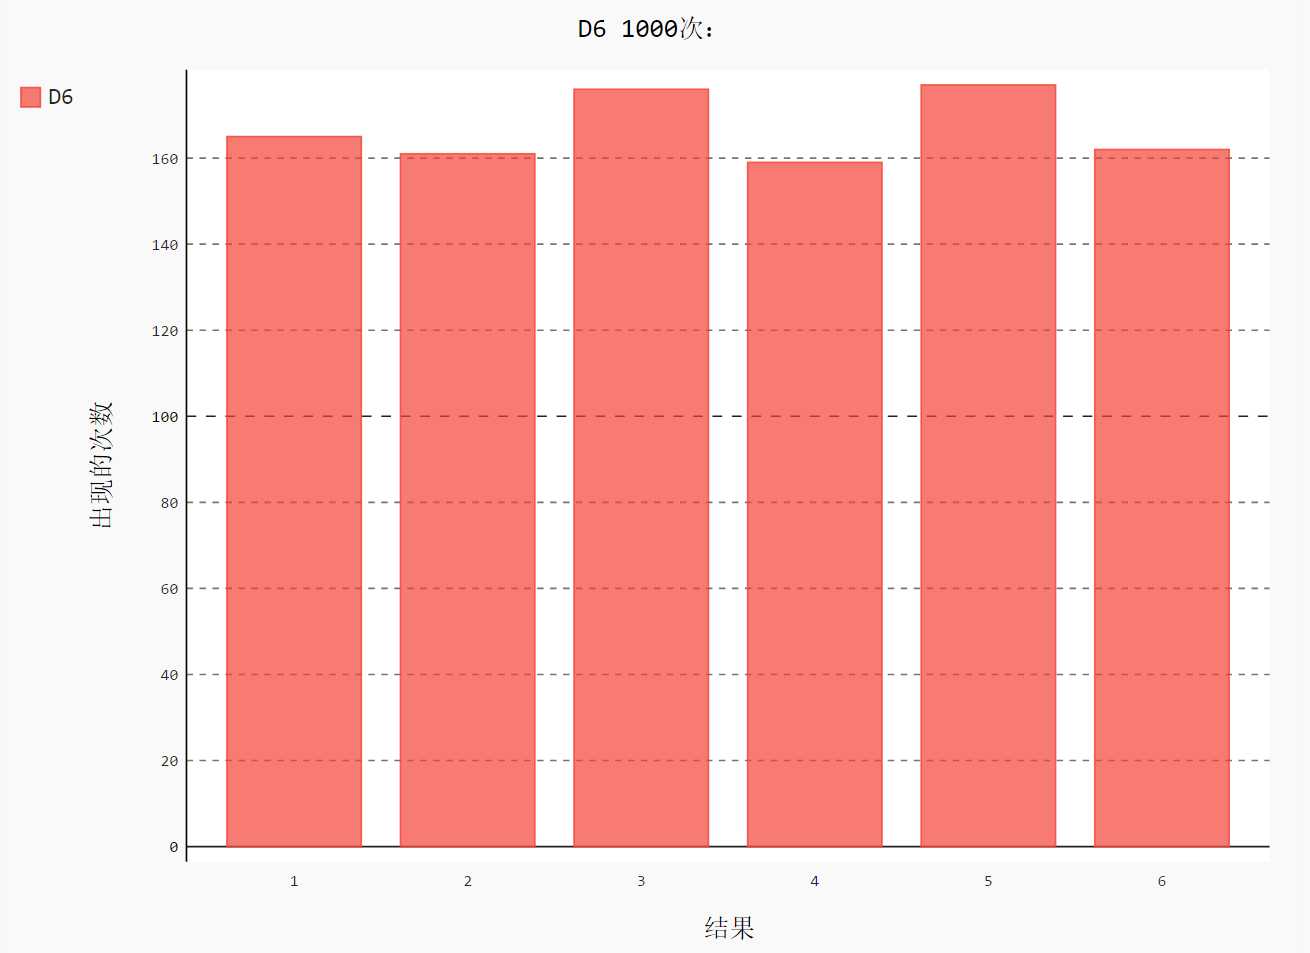
die_visual.py
import pygal

from 骰子.die import Die

# 创建一个 D6
die = Die()

results = []
for roll_num in range(1000):
    result = die.roll()
    results.append(result)

frequencies = []
for value in range(1, die.num_sides+1):
    # 计算某个值出现同样的次数
    frequency = results.count(value)
    frequencies.append(frequency)

# 对结果进行可视化
hist = pygal.Bar()

hist.title = "D6 1000次:"
hist.x_labels = [str(num) for num in range(1, 7)] #[‘1‘, ‘2‘, ‘3‘, ‘4‘, ‘5‘, ‘6‘]
hist.x_title = "结果"
hist.y_title = "概率"

hist.add(‘D6‘, frequencies)
hist.render_to_file(‘images/die_visual.svg‘)
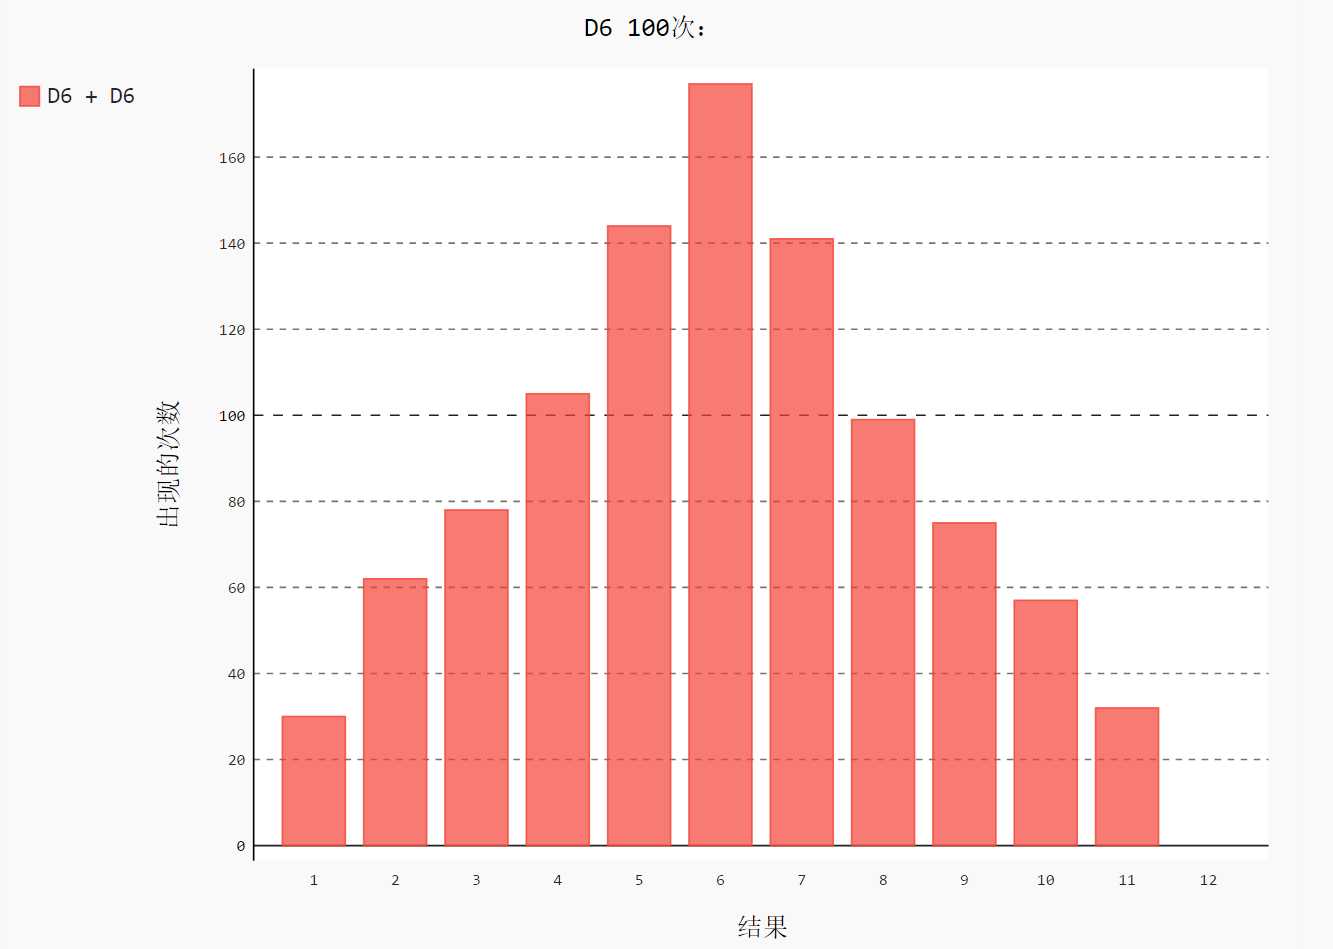
dice_visual.py
import pygal

from 骰子.die import Die

# 创建 2 个 D6
die_1 = Die()
die_2 = Die()

results = []
for roll_num in range(1000):
    result = die_1.roll() + die_2.roll()
    results.append(result)

frequencies = []
max_results = die_1.num_sides + die_2.num_sides
for value in range(2, max_results+1):
    # 计算某个值出现同样的次数
    frequency = results.count(value)
    frequencies.append(frequency)

# 对结果进行可视化
hist = pygal.Bar()

hist.title = "D6 100次:"
hist.x_labels = [str(num) for num in range(1, 13)] #[‘1‘, ‘2‘, ‘3‘, ‘4‘, ‘5‘, ‘6‘, ‘7‘, ‘8‘, ‘9‘, ‘10‘, ‘11‘, ‘12‘]
hist.x_title = "结果"
hist.y_title = "出现的次数"

hist.add(‘D6 + D6‘, frequencies)
hist.render_to_file(‘images/dice_visual.svg‘)
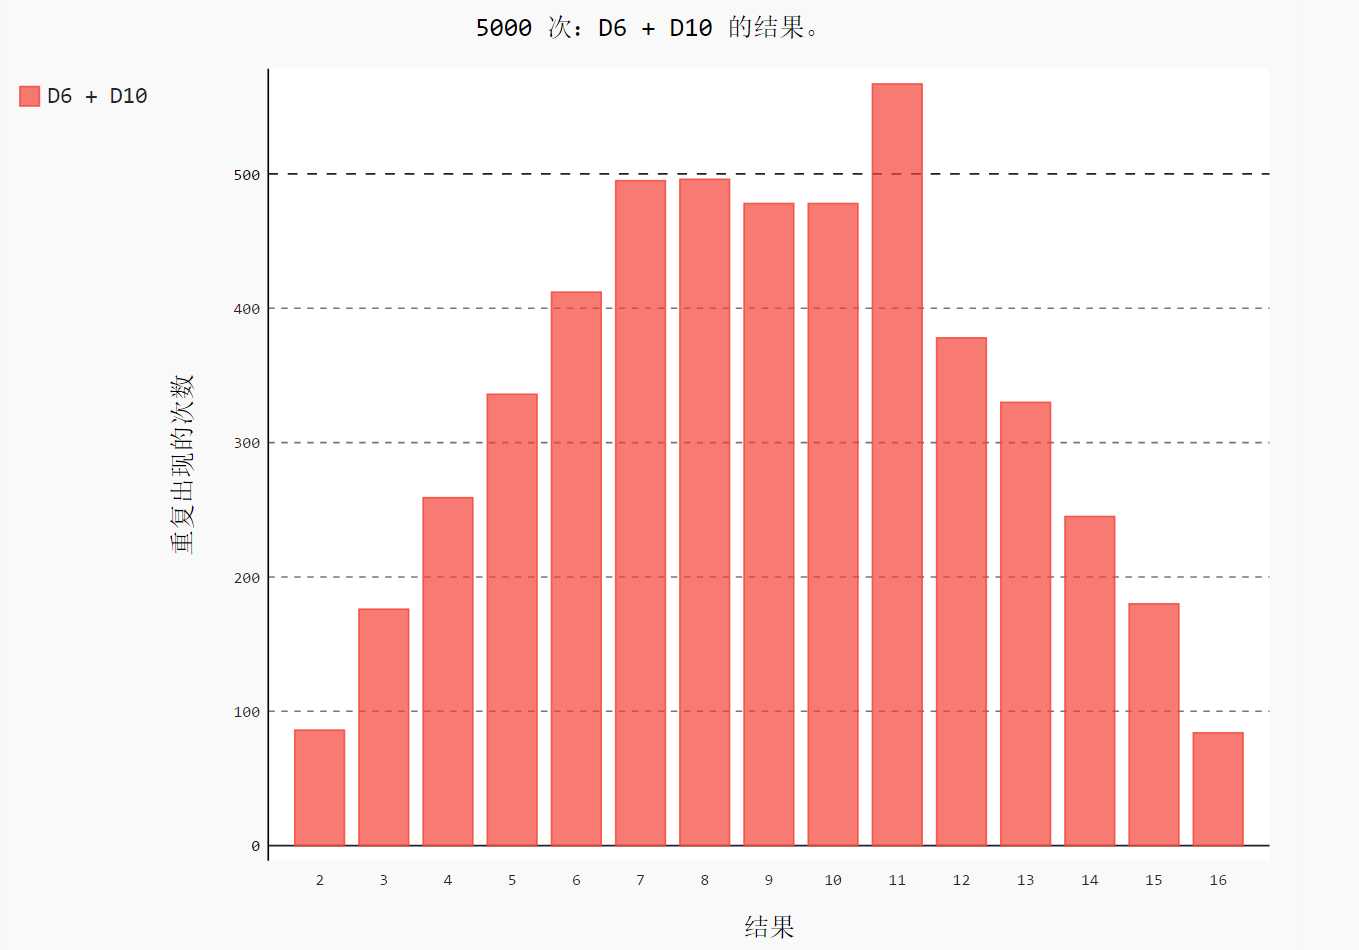
different_dice.py
import pygal

from 骰子.die import Die

# 创建一个 D6 和 D10
die_1 = Die()
die_2 = Die(10)

results = []
for roll_num in range(5000):
    result = die_1.roll() + die_2.roll()
    results.append(result)

frequencies = []
max_results = die_1.num_sides + die_2.num_sides
for value in range(2, max_results+1):
    # 计算某个值出现同样的次数
    frequency = results.count(value)
    frequencies.append(frequency)

# 对结果进行可视化
hist = pygal.Bar()

hist.title = "5000 次:D6 + D10 的结果。"
hist.x_labels = [str(num) for num in range(2, 17)]
hist.x_title = "结果"
hist.y_title = "重复出现的次数"

hist.add(‘D6 + D10‘, frequencies)
hist.render_to_file(‘images/different_visual.svg‘)
GitHub:https://github.com/liqingwen2015/my_data_view
[Python] Python 学习 - 可视化数据操作(一)
标签:cat ext att continue axis values logs 列表 概率
原文地址:http://www.cnblogs.com/liqingwen/p/6790238.html