标签:产生 解决 密码验证 splay 不同的 登陆 设备 ups timeout
Nagios简介
Nagios简介
  Nagios是一款开源的电脑系统和网络监视工具,能有效监控Windows、Linux和Unix的主机状态,交换机路由器等网络设置,打印机等。
  在系统或服务状态异常时发出邮件或短信报警第一时间通知网站运维人员,在状态恢复后发出正常的邮件或短信通知。
  Nagios原名为NetSaint,由Ethan Galstad开发并维护至今。
  NAGIOS是一个缩写形式: "Nagios Ain‘t Gonna Insist On Sainthood" Sainthood 翻译为圣徒,而"Agios"是"saint"的希腊表示方法。
  Nagios被开发在Linux下使用,但在Unix下也工作得非常好。

主要功能
  网络服务监控(SMTP、POP3、HTTP、NNTP、ICMP、SNMP、FTP、SSH)
  主机资源监控(CPU load、disk usage、system logs),也包括Windows主机(使用NSClient++ plugin)
  可以指定自己编写的Plugin通过网络收集数据来监控任何情况(温度、警告……)
  可以通过配置Nagios远程执行插件远程执行脚本
  远程监控支持SSH或SSL加通道方式进行监控
  简单的plugin设计允许用户很容易的开发自己需要的检查服务,支持很多开发语言(shell scripts、C++、Perl、ruby、Python、PHP、C#等)
  包含很多图形化数据Plugins(Nagiosgraph、Nagiosgrapher、PNP4Nagios等)
  可并行服务检查
  能够定义网络主机的层次,允许逐级检查,就是从父主机开始向下检查
  当服务或主机出现问题时发出通告,可通过email, pager, sms 或任意用户自定义的plugin进行通知
  能够自定义事件处理机制重新激活出问题的服务或主机
  自动日志循环
  支持冗余监控
  包括Web界面可以查看当前网络状态,通知,问题历史,日志文件等


监控内容
  1、本地资源:负载uptime,cpu(top,sar),磁盘(df-hi),内存(free swap),IO(iostat),RAID级别,CPU温度,passwd文件的变化,本地所有文件指纹识别监控
  2、网络服务:端口,web(URL),DB,ping丢包,进程数,IDC网络流量
  3、其他设备:路由器、交换机端口流量,监控光衰,打印机,windows等
  4、业务数据:用户登录失败次数,用户登录网站次数。输入验证码失败次数,某个api接口流量并发,电商网站订单,支付交易的数量
  5、监控软件本身仅仅是个平台,我们想监控的内容,理论上只要在服务器命令行可以获取到的数据就可以被监控软件监控

nagios家族成员
nagios监控一般由一个主程序(Nagios),一个插件程序(Nagios-plugins)和一些可选的附加程序(NRPE、NSClient++,NCSA、NDOUtils)
其本身就是个监控平台,具体的监控工作都是通过插件来实现,因此主程序和插件都是服务器端必须要安装的程序组建,Nagios-plugins一般也要安装于被监控端。几个附加程序的描述如下

  1、NRPE:半被动模式daemon
  存在位置:  工作于被监控端,操作系统为LINUX/UNIX
  作用:  用于在被监控的远程LINUX/UNIX主机上执行脚本插件获取数据回传给服务器端,以实现对这些主机资源的监控
  存在形式:  守护进程(agent)模式,开启的端口5666
  主要用于监控本地资源:负载uptime,cpu(top,sar),磁盘(df-hi),内存(free swap),IO(iostat),RAID级别,CPU温度,passwd文件的变化,本地所有文件指纹识别监控

  2、NSClient++:半被动模式
  存在位置:  用于被监控端为windows系统的服务器
  作用:  功能相当于linux下的NRPE
  用于被监控Windows主机时,安装在windows主机上的组建。

  3、NDOUtils(不推荐使用)
  存在位置:  NDOUtils工作于nagios服务器端
  作用:  用于将Nagios的配置信息和各event产生的数据存入数据库以实现对这些数据的检索和处理

  4、NSCA:分布式纯被动模式的监控
  位置:  NSCA同时需要安装在nagios的服务器端和客户端
  作用:  用于让被监控的远程linux/unix主机主动将监控到的信息发送给Nagios服务器(分布式监控集群模式中会用到,500台服务器以内可以不用)
Nagios工作原理
Nagios工作原理 Nagios的功能是监控服务和主机,但是他自身并不包括这部分功能,所有的监控、检测功能都是通过各种插件来完成的。 启动Nagios后,它会周期性的自动调用插件去检测服务器状态,同时Nagios会维持一个队列,所有插件返回来的状态信息都进入队列,Nagios每次都从队首开始读取信息,并进行处理后,把状态结果通过web显示出来。 Nagios提供了许多插件,利用这些插件可以方便的监控很多服务状态。安装完成后,在nagios主目录下的/libexec里放有nagios自带的可以使用的所有插件,如,check_disk是检查磁盘空间的插件,check_load是检查CPU负载的,等等。
每一个插件可以通过运行./check_xxx –h 来查看其使用方法和功能。 Nagios可以识别4种状态返回信息,即
0(OK)表示状态正常/绿色、
1(WARNING)表示出现警告/黄色、
2(CRITICAL)表示出现非常严重的错误/红色、
3(UNKNOWN)表示未知错误/深黄色。
Nagios根据插件返回来的值,来判断监控对象的状态,并通过web显示出来,以供管理员及时发现故障。
四种监控状态
再说报警功能,如果监控系统发现问题不能报警那就没有意义了,所以报警也是nagios很重要的功能之一。但是,同样的,Nagios 自身也没有报警部分的代码,甚至没有插件,而是交给用户或者其他相关开源项目组去完成的。 Nagios 安装,是指基本平台,也就是Nagios软件包的安装。它是监控体系的框架,也是所有监控的基础。 打开Nagios官方的文档,会发现Nagios基本上没有什么依赖包,只要求系统是Linux或者其他Nagios支持的系统。不过如果你没有安装apache(http服务),那么你就没有那么直观的界面来查看监控信息了,所以apache姑且算是一个前提条件。
关于apache的安装,网上有很多,照着安装就是了。安装之后要检查一下是否可以正常工作。 知道Nagios 是如何通过插件来管理服务器对象后,现在开始研究它是如何管理远端服务器对象的。Nagios 系统提供了一个插件NRPE。
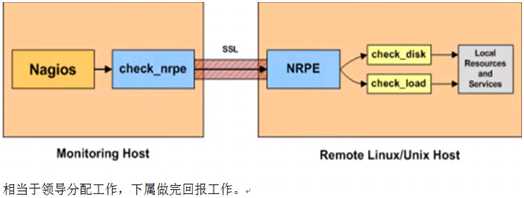
Nagios 通过周期性的运行它来获得远端服务器的各种状态信息。它们之间的关系如下图所示:
Nagios 通过NRPE 来远端管理服务 1. Nagios 执行安装在它里面的check_nrpe 插件,并告诉check_nrpe 去检测哪些服务。 2. 通过SSL,check_nrpe 连接远端机子上的NRPE daemon 3. NRPE 运行本地的各种插件去检测本地的服务和状态(check_disk,..etc) 4. 最后,NRPE 把检测的结果传给主机端的check_nrpe,check_nrpe 再把结果送到Nagios状态队列中。 5. Nagios 依次读取队列中的信息,再把结果显示出来。 半被动模式原理图
192.168.0.83 node83 centos6.7*64 nagios server
192.168.0.84 node83 centos6.7*64 nagios client
192.168.0.85 node83 centos6.7*64 nagios client
192.168.0.86 node83 centos6.7*64 nagios client
Nagios服务端安装 (nagios server)
基础支持套件
#yum install -y gcc glibc glibc-common gd gd-devel xinetd openssl-devel mysql-devel
安装mysql-devel后安装nagios-plugin会自动安装好check_mysql插件,gd是为出图

创建nagios用户和用户组
#useradd   nagios    #如果/sbin/nologin会有问题
#mkdir /usr/local/nagios
#chown -R nagios.nagios /usr/local/nagios
#可以将nagios加到apache组

编译安装Nagios
#wget http://prdownloads.sourceforge.net/sourceforge/nagios/nagios-3.4.3.tar.gz
#gunzip nagios-3.4.3.tar.gz
#tar zxvf nagios-3.4.3.tar
#cd nagios
#./configure --prefix=/usr/local/nagios
make all
make install
make install-init
make install-commandmode
make install-config
chkconfig --add nagios
chkconfig --level 35 nagios on
chkconfig --list nagios

验证程序是否被正确安装
是否存在etc、bin、sbin、share、var 这五个目录,如果存在则可以表明程序被正确的安装到系统
#tree -L 1 /usr/local/nagios
/usr/local/nagios
|-- bin    Nagios 可执行程序所在目录
|-- etc    Nagios 配置文件所在目录
|-- libexec  Nagios 外部插件所在目录
|-- sbin    Nagios CGI 文件所在目录,也就是执行外部命令所需文件所在的目录
|-- share   Nagios网页文件所在的目录
`-- var    Nagios 日志文件、lock 等文件所在的目录 archives 日志归档  rw 用来存放外部命令文件目录

安装nagios-plugins
#tar zxvf nagios-plugins-1.4.16.tar.gz
#cd nagios-plugins-1.4.16
#./configure --prefix=/usr/local/nagios
#make
#make install
#ls /usr/local/nagios/libexec/  各种插件
check_apt      check_disk_smb  check_ide_smart     check_mailq        check_nt        check_pop      check_ssh    check_wave
check_breeze   check_dns       check_ifoperstatus  check_mrtg         check_ntp       check_procs    check_ssmtp  negate
check_by_ssh   check_dummy     check_ifstatus      check_mrtgtraf     check_ntp_peer  check_real     check_swap   urlize
check_clamd    check_file_age  check_imap          check_mysql        check_ntp_time  check_rpc      check_tcp    utils.pm
check_cluster  check_flexlm    check_ircd          check_mysql_query  check_nwstat    check_sensors  check_time   utils.sh
check_dhcp     check_ftp       check_jabber        check_nagios       check_oracle    check_simap    check_udp
check_dig      check_http      check_load          check_nntp         check_overcr    check_smtp     check_ups
check_disk     check_icmp      check_log           check_nntps        check_ping      check_spop     check_users

安装check_nrpe 插件(nagios客户端)
#tar zxvf nrpe-2.13.tar.gz
#cd nrpe-2.13
#./configure        #type ‘make all‘ to compile the NRPE daemon and client.
#make all
#make install-plugin
#ls /usr/local/nagios/libexec/ | grep nrpe
check_nrpe
#只运行这一步就行了,因为只需要check_nrpe插件。也可以接着进行,这样nagios自身也通过check_nrpe来实现监控
# make install-daemon
# make install-daemon-config
#/usr/local/nagios/bin/nrpe -c /usr/local/nagios/etc/nrpe.cfg -d
#echo "/usr/local/nagios/bin/nrpe -c /usr/local/nagios/etc/nrpe.cfg -d" /etc/rc.local

在Nagios-Linux 上我们已经装好了nrpe,现在我们测试一下使用check_nrpe 与nrpe daemon之间的通信。
# /usr/local/nagios/libexec/check_nrpe -H localhost
NRPE v2.13
# /usr/local/nagios/libexec/check_nrpe -H localhost -c check_load
OK - load average: 0.01, 0.01, 0.00|load1=0.010;15.000;30.000;0; load5=0.010;10.000;25.000;0; load15=0.000;5.000;20.000;0;


在commands.cfg中增加对check_nrpe的定义
# vi /usr/local/nagios/etc/objects/commands.cfg
在最后面增加如下内容:
# ‘check_nrpe‘ command definition
define command{
command_name  check_nrpe                             # 定义命令名称为check_nrpe,在services.cfg中要使用这个名称.
command_line    $USER1$/check_nrpe -H $HOSTADDRESS$ -c $ARG1$        #这是定义实际运行的插件程序.
  }# 这个命令行的书写要完全按照check_nrpe这个命令的用法,不知道用法的就用check_nrpe –h查看.

-c 后面带的$ARG1$ 参数是传给nrpe daemon 执行的检测命令,必须在nrpe.cfg 中所定义。在services.cfg 中使用check_nrpe 的时候要用 “!” 带上这个参数。


=============================================================================================================================================

安装与配置Apache和PHP
Apache 和Php 不是安装nagios 所必须的,但是nagios提供了web监控界面,通过web监控界面可以清晰的看到被监控主机、资源的运行状态,因此,安装一个web服务是很必要的。
需要注意的是,nagios在nagios3.1.x版本以后,配置web监控界面时需要php的支持。这里我们下载的nagios版本为nagios-3.4.3,因此在编译安装完成apache后,还需要编译php模块,这里选取的php版本为php5.4.10。

a. 安装Apache
wget http://archive.apache.org/dist/httpd/httpd-2.2.23.tar.gz
tar zxvf httpd-2.2.23.tar.gz
cd httpd-2.2.23
 ./configure --prefix=/usr/local/apache2
make
make install
若出现错误:则在编译时入加 --with-included-apr

b. 安装PHP
#yum install libxml2* -y
# wget http://cn2.php.net/distributions/php-5.4.10.tar.gz
#tar zxvf php-5.4.10.tar.gz
#cd php-5.4.10
#./configure --prefix=/usr/local/php  --with-zlib --with-gd --with-apxs2=/usr/local/apache2/bin/apxs [pnp出图依赖gd及zlib]
# make && make install
如果报错libtool: link: `ext/date/lib/parse_tz.lo‘ is not a valid libtool object
解决方案make clean

c. 配置apache
#vi /usr/local/apache2/conf/httpd.conf
User daemon
Group daemon
修改为
User nagios
Group nagios
然后找到
<IfModule dir_module>
  DirectoryIndex index.html
</IfModule>
修改为 <IfModule dir_module>
    DirectoryIndex index.html index.php      #增加indx.php
</IfModule>
AddType application/x-httpd-php .php        #增加内容

为了安全起见,一般情况下要让nagios 的web 监控页面必须经过授权才能访问,这需要增加验证配置,
即在httpd.conf 文件最后添加如下信息:
 #setting for nagios
ScriptAlias /nagios/cgi-bin "/usr/local/nagios/sbin"
<Directory "/usr/local/nagios/sbin">
     AuthType Basic
     Options ExecCGI
     AllowOverride None
     Order allow,deny
     Allow from all
     AuthName "Nagios Access"
     AuthUserFile /usr/local/nagios/etc/htpasswd             //用于此目录访问身份验证的文件
     Require valid-user
</Directory>
Alias /nagios "/usr/local/nagios/share"
<Directory "/usr/local/nagios/share">
     AuthType Basic
     Options None
     AllowOverride None
     Order allow,deny
     Allow from all
     AuthName "nagios Access"
     AuthUserFile /usr/local/nagios/etc/htpasswd
     Require valid-user
</Directory>


创建apache目录验证文件
在上面的配置中,指定了目录验证文件htpasswd,下面要创建这个文件:
# /usr/local/apache2/bin/htpasswd -c /usr/local/nagios/etc/htpasswd gtms
# cat /usr/local/nagios/etc/htpasswd
gtms:$apr1$UZ1dvVHu$4q2MyUNSPGL8DuFp38lyY.
#sed -i ‘s/nagiosadmin/nagiosadmin,gtms /g‘ /usr/local/nagios/etc/cgi.cfg     #==>后面会讲到,因为gtms默认没有cgi执行权限,访问web时会提示无cgi权限
当通过http://192.168.1.108/nagios/ 访问时就需要输入用户名和密码了。
(测试中再添加一个用户,gtms被覆盖,因此创建htpasswd1,然后把内容追加到htpasswd)

启动nagios/apache 服务
# /etc/init.d/nagios start
# /usr/local/apache2/bin/apachectl start
到这里nagios 的安装也就基本完成了,你可以通过web来访问了。http://serverip/nagios
配置Nagios
Nagios 主要用于监控一台或者多台本地主机及远程的各种信息,包括本机资源及对外的服务等。默认的Nagios 配置没有任何监控内容,仅是一些模板文件。若要让Nagios 提供服务,就必须修改配置文件,增加要监控的主机和服务,下面将详细介绍。

默认配置文件介绍
    Nagios 安装完毕后,默认的配置文件在/usr/local/nagios/etc目录下。
# tree
|-- cgi.cfg        控制CGI访问的配置文件
|-- htpasswd       密码验证文件
|-- nagios.cfg     Nagios 主配置文件
|-- objects        是一个目录,在此目录下有很多配置文件模板,用于定义Nagios 对象
|   |-- commands.cfg    命令定义配置文件,其中定义的命令可以被其他配置文件引用
|   |-- contacts.cfg    定义联系人和联系人组的配置文件
|   |-- localhost.cfg    定义监控本地主机的配置文件
|   |-- printer.cfg      定义监控打印机的一个配置文件模板,默认没有启用此文件
|   |-- switch.cfg        定义监控路由器的一个配置文件模板,默认没有启用此文件
|   |-- templates.cfg     定义主机和服务的一个模板配置文件,可以在其他配置文件中引用
|   |-- timeperiods.cfg    定义Nagios 监控时间段的配置文件
|   `-- windows.cfg       监控Windows 主机的一个配置文件模板,默认没有启用此文件
`-- resource.cfg    变量定义文件,又称为资源文件,在些文件中定义变量,以便由其他配置文件引用,如$USER1$

配置文件之间的关系
在nagios的配置过程中涉及到的几个定义有:主机、主机组,服务、服务组,联系人、联系人组,监控时间,监控命令等,从这些定义可以看出,nagios各个配置文件之间是互为关联,彼此引用的。
成功配置出一台nagios监控系统,必须要弄清楚每个配置文件之间依赖与被依赖的关系,最重要的有四点:
  第一:定义监控哪些主机、主机组、服务和服务组;
  第二:定义这个监控要用什么命令实现;
  第三:定义监控的时间段;
  第四:定义主机或服务出现问题时要通知的联系人和联系人组。

配置Nagios
 为了能更清楚的说明问题,同时也为了维护方便,建议将nagios各个定义对象创建独立的配置文件:
?    创建hosts.cfg文件来定义主机和主机组(默认不存在,注意授权)
?    创建services.cfg文件来定义服务(默认不存在,,注意授权)
touch /usr/local/nagios/etc/objects/services.cfg
touch /usr/local/nagios/etc/objects/hosts.cfg
chown nagios.nagios /usr/local/nagios/etc/objects/services.cfg
chown nagios.nagios /usr/local/nagios/etc/objects/hosts.cfg

# vi /usr/local/nagios/etc/nagios.cfg 加入(locahost的可以注释不用)
cfg_file=/usr/local/nagios/etc/objects/services.cfg
cfg_file=/usr/local/nagios/etc/objects/hosts.cfg

?    用默认的contacts.cfg文件来定义联系人和联系人组
?    用默认的commands.cfg文件来定义命令
?    用默认的timeperiods.cfg来定义监控时间段
?    用默认的templates.cfg文件作为资源引用文件

a. templates.cfg文件
nagios主要用于监控主机资源以及服务,在nagios配置中称为对象,为了不必重复定义一些监控对象,Nagios引入了一个模板配置文件,将一些共性的属性定义成模板,以便于多次引用。
下面详细介绍下templates.cfg文件中每个参数的含义:
define contact{
name                            generic-contact   ; 联系人名称
service_notification_period      24x7         ;服务异常时,通知的时间段,"24x7"在timeperiods.cfg中定义
host_notification_period         24x7         ;主机异常时,通知的时间段,"24x7"在timeperiods.cfg中定义
service_notification_options      w,u,c,r        ; 这个定义的是“通知可以被发出的情况”。w即warn,表示警告状态,u即unknown,表示不明状态;; c即criticle,表示紧急状态,r即recover,表示恢复状态; ; 也就是在服务出现警告状态、未知状态、紧急状态和重新恢复状态时都发送通知给使用者。
host_notification_options         d,u,r          ;定义主机在什么状态下需要发送通知给使用者,d即down,表示宕机状态;; u即unreachable,表示不可到达状态,r即recovery,表示重新恢复状态。
service_notification_commands   notify-service-by-email ;服务故障时,发送通知的方式,可以是邮件和短信,这里发送的方式是邮件; ; 其中“notify-service-by-email”在commands.cfg文件中定义。
host_notification_commands      notify-host-by-email    ;主机故障时,发送通知的方式,可以是邮件和短信,这里发送的方式是邮件; ; 其中“notify-host-by-email”在commands.cfg文件中定义。
register                        0                      ; DONT REGISTER THIS DEFINITION - ITS NOT A REAL CONTACT, JUST A TEMPLATE!
        }

define host{
name                generic-host        ; 主机名称,这里的主机名,并不是直接对应到真正机器的主机名;; 而是对应到在主机配置文件里所设定的主机名。
notifications_enabled           1               ; Host notifications are enabled
event_handler_enabled           1               ; Host event handler is enabled
flap_detection_enabled          1               ; Flap detection is enabled
failure_prediction_enabled      1               ; Failure prediction is enabled
process_perf_data               1            ;其值可以为0或1,其作用为是否启用Nagios的数据输出功能; ; 如果将此项赋值为1,那么Nagios就会将收集的数据写入某个文件中,以备提取。
retain_status_information       1            ; Retain status information across program restarts
retain_nonstatus_information    1            ; Retain non-status information across program restarts
notification_period             24x7         ; 指定“发送通知”的时间段
register                        0                 ; DONT REGISTER THIS DEFINITION - ITS NOT A REAL HOST, JUST A TEMPLATE!
        }

define host{
name            linux-server            ; 主机名称
use             generic-host        ; use表示引用,也就是将主机generic-host的所有属性引用到linux-server中来; ; 在nagios配置中,很多情况下会用到引用。
check_period      24x7              ; 这里的check_period告诉nagios检查主机的时间段
check_interval     5                ; nagios对主机的检查时间间隔,这里是5分钟。
retry_interval     1                ; 重试检查时间间隔,单位是分钟。
max_check_attempts   10           ; nagios对主机的最大检查次数,也就是nagios在检查发现某主机异常时,并不马上判断为异常状况; ; 而是多试几次,因为有可能只是一时网络太拥挤,或是一些其他原因,让主机受到了一点影响;; 这里的10就是最多试10次的意思。
check_command   check-host-alive   ; 指定检查主机状态的命令,其中“check-host-alive”在commands.cfg文件中定义。
notification_period     24x7        ;主机故障时,发送通知的时间范围,其中“workhours”在    timeperiods.cfg中进行了定义; ; 下面会陆续讲到。
notification_interval    10      ; 在主机出现异常后,故障一直没有解决,nagios再次对使用者发出通知的时间。单位是分钟; ; 如果你觉得,所有的事件只需要一次通知就够了,可以把这里的选项设为0
notification_options   d,u,r    ; 定义主机在什么状态下可以发送通知给使用者,d即down,表示宕机状态; ; u即unreachable,表示不可到达状态; ; r即recovery,表示重新恢复状态。
contact_groups       ts           ; 指定联系人组,这个“admins”在contacts.cfg文件中定义。
register             0             ; DONT REGISTER THIS DEFINITION - ITS NOT A REAL HOST, JUST A TEMPLATE!
        }

define host{
name       windows-server      ; The name of this host template
use        generic-host        ; Inherit default values from the generic-host template
check_period      24x7              ; By default, Windows servers are monitored round the clock
check_interval        5               ; Actively check the server every 5 minutes
retry_interval         1               ; Schedule host check retries at 1 minute intervals
max_check_attempts    10              ; Check each server 10 times (max)
check_command        check-host-alive        ; Default command to check if servers are "alive"
notification_period     24x7            ; Send notification out at any time - day or night
notification_interval    10              ; Resend notifications every 30 minutes
notification_options    d,r             ; Only send notifications for specific host states
contact_groups        ts              ; Notifications get sent to the admins by default
hostgroups          windows-servers   ; Host groups that Windows servers should be a member of
register                0               ; DONT REGISTER THIS - ITS JUST A TEMPLATE

        }
define service{
name                generic-service        ; 定义一个服务名称
active_checks_enabled        1                ; Active service checks are enabled
passive_checks_enabled       1                ; Passive service checks are enabled/accepted
parallelize_check            1                 ; Active service checks should be parallelized;
 ; (disabling this can lead to major performance problems)
obsess_over_service            1             ; We should obsess over this service (if necessary)
check_freshness               0            ; Default is to NOT check service ‘freshness‘
notifications_enabled           1              ; Service notifications are enabled
event_handler_enabled          1             ; Service event handler is enabled
flap_detection_enabled          1              ; Flap detection is enabled
failure_prediction_enabled      1           ; Failure prediction is enabled
process_perf_data             1           ; Process performance data
retain_status_information       1           ; Retain status information across program restarts
retain_nonstatus_information    1           ; Retain non-status information across program restarts
is_volatile                   0          ; The service is not volatile
check_period                24x7         ; 这里的check_period告诉nagios检查服务的时间段。
max_check_attempts              3         ; nagios对服务的最大检查次数。
normal_check_interval           5        ; 此选项是用来设置服务检查时间间隔,也就是说,nagios这一次检查和下一次检查之间所隔的时间; ; 这里是5分钟。
retry_check_interval            2                ; 重试检查时间间隔,单位是分钟。
contact_groups                 ts           ; 指定联系人组
notification_options            w,u,c,r          ; 这个定义的是“通知可以被发出的情况”。w即warn,表示警告状态; ; u即unknown,表示不明状态; ; c即criticle,表示紧急状态,r即recover,表示恢复状态; ; 也就是在服务出现警告状态、未知状态、紧急状态和重新恢复后都发送通知给使用者。
notification_interval           10               ; Re-notify about service problems every hour
notification_period             24x7             ; 指定“发送通知”的时间段,也就是可以在什么时候发送通知给使用者。
register                        0                ; DONT REGISTER THIS DEFINITION - ITS NOT A REAL SERVICE, JUST A TEMPLATE!
        }
define service{
name                  local-service     ; The name of this service template
use                   generic-service   ; Inherit default values from the generic-service definition
max_check_attempts         4          ; Re-check the service up to 4 times in order to determine its final (hard) state
normal_check_interval       5           ; Check the service every 5 minutes under normal conditions
retry_check_interval        1          ; Re-check the service every minute until a hard state can be determined
register                   0             ; DONT REGISTER THIS DEFINITION - ITS NOT A REAL SERVICE, JUST A TEMPLATE!
        }
b. resource.cfg文件(之前已经配置)
resource.cfg是nagios的变量定义文件,文件内容只有一行:
$USER1$=/usr/local/nagios/libexec
其中,变量$USER1$指定了安装nagios插件的路径,如果把插件安装在了其它路径,只需在这里进行修改即可。需要注意的是,变量必须先定义,然后才能在其它配置文件中进行引用。

c. commands.cfg文件
此文件默认是存在的,无需修改即可使用,当然如果有新的命令需要加入时,在此文件进行添加即可。
define command{
        command_name    check_nrpe
        command_line    $USER1$/check_nrpe -H $HOSTADDRESS$  -c $ARG1$
        }


d. hosts.cfg文件
此文件默认不存在,需要手动创建,hosts.cfg主要用来指定被监控的主机地址以及相关属性信息(在监控配置一节中进行配置)

c. localhost.cfg

define host{
        use                  linux-server            ; Name of host template to use
                            ; This host definition will inherit all variables that are defined
                             ; in (or inherited by) the linux-server host template definition.
        host_name             Nagios-Server
        alias                   Nagios-Server
        address                 127.0.0.1
        }
define hostgroup{
        hostgroup_name  linux-servers ; The name of the hostgroup
        alias           Linux Servers ; Long name of the group
        members         Nagios-Server ; Comma separated list of hosts that belong to this group
        }
define service{
        use                            local-service         ; Name of service template to use
        host_name                      Nagios-Server
        service_description               PING
        check_command                 check_ping!100.0,20%!500.0,60%
        }
define service{
        use                             local-service         ; Name of service template to use
        host_name                       Nagios-Server
        service_description             Root Partition
        check_command                   check_local_disk!20%!10%!/
        }
define service{
        use                             local-service         ; Name of service template to use
        host_name                       Nagios-Server
        service_description               Current Users
        check_command                   check_local_users!20!50
        }
define service{
        use                             local-service         ; Name of service template to use
        host_name                       Nagios-Server
        service_description             Total Processes
        check_command                   check_local_procs!250!400!RSZDT
        }
define service{
        use                             local-service         ; Name of service template to use
        host_name                       Nagios-Server
        service_description             Current Load
        check_command                   check_local_load!5.0,4.0,3.0!10.0,6.0,4.0
        }
define service{
        use                             local-service         ; Name of service template to use
        host_name                       Nagios-Server
        service_description             Swap Usage
        check_command                   check_local_swap!20!10
        }
define service{
        use                             local-service         ; Name of service template to use
        host_name                       Nagios-Server
        service_description             SSH
        check_command                   check_ssh
        notifications_enabled           0
        }
define service{
        use                             local-service         ; Name of service template to use
        host_name                       Nagios-Server
        service_description             HTTP
        check_command                   check_http
        notifications_enabled           0
        }
d. windows.cfg
define host{
        use             windows-server  ; Inherit default values from a template
        host_name       Nagios-Windows  ; The name we‘re giving to this host
        alias           My Windows Server       ; A longer name associated with the host
        address         192.168.1.113   ; IP address of the host
        }
define hostgroup{
        hostgroup_name  windows-servers ; The name of the hostgroup
        alias           Windows Servers ; Long name of the group
        }
define service{
        use                     generic-service
        host_name               Nagios-Windows
        service_description     NSClient++ Version
        check_command           check_nt!CLIENTVERSION
        }
define service{
        use                     generic-service
        host_name               Nagios-Windows
        service_description     Uptime
        check_command           check_nt!UPTIME
        }
define service{
        use                     generic-service
        host_name               Nagios-Windows
        service_description     CPU Load
        check_command           check_nt!CPULOAD!-l 5,80,90
        }
define service{
        use                     generic-service
        host_name               Nagios-Windows
        service_description     Memory Usage
        check_command           check_nt!MEMUSE!-w 80 -c 90
        }
define service{
        use                     generic-service
        host_name               Nagios-Windows
        service_description     C:\ Drive Space
        check_command           check_nt!USEDDISKSPACE!-l c -w 80 -c 90
        }
define service{
        use                     generic-service
        host_name               Nagios-Windows
        service_description     W3SVC
        check_command           check_nt!SERVICESTATE!-d SHOWALL -l W3SVC
        }
define service{
        use                     generic-service
        host_name               Nagios-Windows
        service_description     Explorer
        check_command           check_nt!PROCSTATE!-d SHOWALL -l Explorer.exe
e. services.cfg文件
此文件默认也不存在,需要手动创建,services.cfg文件主要用于定义监控的服务和主机资源,例如监控http服务、ftp服务、主机磁盘空间、主机系统负载等等。(在监控配置一节中配置)


f. contacts.cfg文件
contacts.cfg是一个定义联系人和联系人组的配置文件,当监控的主机或者服务出现故障,nagios会通过指定的通知方式(邮件或者短信)将信息发给这里指定的联系人或者使用者。
define contact{
contact_name     David             #联系人的名称,这个地方不要有空格
use       generic-contact   #引用generic-contact模板,在templates.cfg文件中有定义
alias        Nagios Admin
email             david.tang@bsmart.cn }

define contactgroup{
contactgroup_name       ts                     #联系人组的名称,同样不能空格
alias                   Technical Support      #联系人组描述
members                 David       }          #联系人组成员,其中“david”就是上面定义的联系                    人,如果有多个联系人则以逗号相隔

g. timeperiods.cfg文件
此文件只要用于定义监控的时间段
#下面是定义一个名为24x7的时间段,即监控所有时间段
define timeperiod{
        timeperiod_name 24x7       #时间段的名称,这个地方不要有空格
        alias           24 Hours A Day, 7 Days A Week
        sunday          00:00-24:00
        monday          00:00-24:00
        tuesday         00:00-24:00
        wednesday       00:00-24:00
        thursday        00:00-24:00
        friday          00:00-24:00
        saturday        00:00-24:00
        }
#下面是定义一个名为workhours的时间段,即工作时间段。
define timeperiod{
        timeperiod_name workhours
        alias           Normal Work Hours
        monday          09:00-17:00
        tuesday         09:00-17:00
        wednesday       09:00-17:00
        thursday        09:00-17:00
        friday          09:00-17:00
        }

h. cgi.cfg文件(之前已配置)
此文件用来控制相关cgi脚本,如果想在nagios的web监控界面执行cgi脚本,例如重启nagios进程、关闭nagios通知、停止nagios主机检测等,这时就需要配置cgi.cfg文件了。
由于nagios的web监控界面验证用户为david,所以只需在cgi.cfg文件中添加此用户的执行权限就可以了,需要修改的配置信息如下:
sed -i ‘s/nagiosadmin/nagiosadmin,gtms /g‘ /usr/local/nagios/etc/cgi.cfg
default_user_name=authorized_for_system_information=nagiosadmin,david
authorized_for_configuration_information=nagiosadmin,david
authorized_for_system_commands=david
authorized_for_all_services=nagiosadmin,david
authorized_for_all_hosts=nagiosadmin,david
authorized_for_all_service_commands=nagiosadmin,david
authorized_for_all_host_commands=nagiosadmin,david

i. nagios.cfg文件
nagios.cfg默认的路径为/usr/local/nagios/etc/nagios.cfg,是nagios的核心配置文件
所有的对象配置文件都必须在这个文件中进行定义才能发挥其作用,这里只需将对象配置文件在Nagios.cfg文件中进行引用即可。

log_file=/usr/local/nagios/var/nagios.log                  # 定义nagios日志文件的路径
cfg_file=/usr/local/nagios/etc/objects/commands.cfg        # “cfg_file”变量用来引用对象配置文件,如果有更多的对象配置文件,在这里依次添加即可。
cfg_file=/usr/local/nagios/etc/objects/contacts.cfg
cfg_file=/usr/local/nagios/etc/objects/hosts.cfg  之前已加入
cfg_file=/usr/local/nagios/etc/objects/services.cfg
#cfg_dir=/usr/local/nagios/etc/objects/services       #可以是个目录service,然后可以创建不同的cfg
cfg_file=/usr/local/nagios/etc/objects/timeperiods.cfg
cfg_file=/usr/local/nagios/etc/objects/templates.cfg
cfg_file=/usr/local/nagios/etc/objects/localhost.cfg     # 本机配置文件,可以注释掉,按照普通的host。
cfg_file=/usr/local/nagios/etc/objects/windows.cfg         # windows 主机配置文件
object_cache_file=/usr/local/nagios/var/objects.cache      # 该变量用于指定一个“所有对象配置文件”的副本文件,或者叫对象缓冲文件
precached_object_file=/usr/local/nagios/var/objects.precache
resource_file=/usr/local/nagios/etc/resource.cfg           # 该变量用于指定nagios资源文件的路径,可以在nagios.cfg中定义多个资源文件。
status_file=/usr/local/nagios/var/status.dat               # 该变量用于定义一个状态文件,此文件用于保存nagios的当前状态、注释和宕机信息等。
status_update_interval=10                                  # 该变量用于定义状态文件(即status.dat)的更新时间间隔,单位是秒,最小更新间隔是1秒。
nagios_user=nagios                              # 该变量指定了Nagios进程使用哪个用户运行。
nagios_group=nagios                             # 该变量用于指定Nagios使用哪个用户组运行。
check_external_commands=1                       # 该变量用于设置是否允许nagios在web监控界面运行cgi命令;
                                                # 也就是是否允许nagios在web界面下执行重启nagios、停止主机/服务检查等操作;# “1”为允许,“0”为不允许。
command_check_interval=10s      # 该变量用于设置nagios对外部命令检测的时间间隔,如果指定了一个数字加一个"s"(如10s); 那么外部检测命令的间隔是这个数值以秒为单位的时间间隔;
                    如果没有用"s",那么外部检测命令的间隔是以这个数值的“时间单位”的时间间隔。
interval_length=60               # 该变量指定了nagios的时间单位,默认值是60秒,也就是1分钟;# 即在nagios配置中所有的时间单位都是分钟。
Nagios的启动与停止
验证Nagios 配置文件的正确性,语法检查
Nagios 在验证配置文件方面做的非常到位,只需通过一个命令即可完成:
# /usr/local/nagios/bin/nagios -v /usr/local/nagios/etc/nagios.cfg
# /etc/init.d/nagios checkconfig  此方法比上述方法方便
# vi /etc/init.d/nagios
 $NagiosBin -v $NagiosCfgFile > /dev/null 2>&1    定义到空去掉

Nagios提供的这个验证功能非常有用,在错误信息中通常会打印出错误的配置文件以及文件中的哪一行,这使得nagios的配置变得非常容易,报警信息通常是可以忽略的,因为一般那些只是建议性的。
看到上面这些信息就说明没问题了,然后启动Nagios 服务。
启动Nagios
a. 通过初始化脚本启动nagios
# /etc/init.d/nagios start  or   # service nagios start
b. 手工方式启动nagios
通过nagios命令的“-d”参数来启动nagios守护进程:
# /usr/local/nagios/bin/nagios -d /usr/local/nagios/etc/nagios.cfg

重启Nagios
当修改了配置文件让其生效时,需要重启/重载Nagios服务。
a. 通过初始化脚本来重启nagios
# /etc/init.d/nagios reload
# /etc/init.d/nagios restart
# service nagios restart

#service nagios restart
Running configuration check…done.
Stopping nagios: done.
Starting nagios:This account is currently not available.
 done.
解决方法:
修改/etc/passwd
将/sbin/nologin改成/bin/bash

b、通过web监控页重启nagios
可以通过web监控页的 "Process Info" -> "Restart the Nagios process"来重启nagios

c、手工方式平滑重启
# kill -HUP <nagios_pid>

停止Nagios
a. 通过初始化脚本关闭nagios服务
# /etc/init.d/nagios stop
or
# service nagios stop

b. 通过web监控页停止nagios
可以通过web监控页的 "Process Info" -> "Shutdown the Nagios process"来停止nagios

c. 手工方式停止Nagios
# kill <nagios_pid>
利用NRPE监控远程Linux上的“本地信息”
利用NRPE监控远程Linux上的“本地信息” 上面已经对远程Linux 主机是否存活做了监控,而判断远程机器是否存活,我们可以使用ping 工具对其监测。还有一些远程主机服务,例如ftp、ssh、http,都是对外开放的服务,即使不用Nagios,我们也可以试的出来,随便找一台机器看能不能访问这些服务就行了。但是对于像磁盘容量,cpu负载这样的“本地信息”,Nagios只能监测自己所在的主机,而对其他的机器则显得有点无能为力。毕竟没得到被控主机的适当权限是不可能得到这些信息的。为了解决这个问题,nagios有这样一个附加组件--“NRPE”,用它就可以完成对Linux 类型主机"本地信息”的监控。 9.1 NRPE 工作原理NRPE 总共由两部分组成: ? check_nrpe 插件,位于监控主机上 ? NRPE daemon,运行在远程的Linux主机上(通常就是被监控机) 按照上图,整个的监控过程如下: 当Nagios 需要监控某个远程Linux 主机的服务或者资源情况时: 1. Nagios 会运行check_nrpe 这个插件,告诉它要检查什么; 2. check_nrpe 插件会连接到远程的NRPE daemon,所用的方式是SSL; 3. NRPE daemon 会运行相应的Nagios 插件来执行检查; 4. NRPE daemon 将检查的结果返回给check_nrpe 插件,插件将其递交给nagios做处理。 注意:NRPE daemon 需要Nagios 插件安装在远程的Linux主机上,否则,daemon不能做任何的监控。
在被监控机(Nagios client)上
a. 增加用户&设定密码
#useradd nagios -s /sbin/nologin -M
#yum install mysql-devel openssl-devel -y

b. 安装Nnagios-plugins 插件
# tar zxvf nagios-plugins-1.4.16.tar.gz
# cd nagios-plugins-1.4.16
# ./configure --prefix=/usr/local/nagios
# make && make install
#ls /usr/local/nagios/
include  libexec  share
# chown nagios.nagios /usr/local/nagios
# chown -R nagios.nagios /usr/local/nagios/libexec

#centos5系列可能需要perl-devel,并--enable-perl)

=============因为没装openssl,报错
check_http.c:312: error: (Each undeclared identifier is reported only once
check_http.c:312: error: for each function it appears in.)
make[2]: *** [check_http.o] Error 1
make[2]: Leaving directory `/home/tools/nagios-plugins-1.4.16/plugins‘
make[1]: *** [all-recursive] Error 1
make[1]: Leaving directory `/home/tools/nagios-plugins-1.4.16‘
make: *** [all] Error 2
============


c. 安装NRPE
# wget http://prdownloads.sourceforge.net/sourceforge/nagios/nrpe-2.13.tar.gz
# gunzip  nrpe-2.13.tar.gz
# tar xvf nrpe-2.13.tar
# cd nrpe-2.13
# ./configure
# make all
# make install-plugin   被监控机可以不需要,建议安装,即check_nrpe插件,可以进行本地验证
# make install-daemon
# make install-daemon-config
==========================================================xinted方式
按照安装文档的说明,是将NRPE deamon作为xinetd下的一个服务运行的。在这样的情况下xinetd就必须要先安装好,不过一般系统已经默认安装了。
d. 安装xinted 脚本
# make install-xinetd

可以看到创建了这个文件/etc/xinetd.d/nrpe。
编辑这个脚本:在only_from 后增加监控主机的IP地址。only_from  =127.0.0.1 serverip
编辑/etc/services 文件,增加NRPE服务
nrpe        5666/tcp    #nrpe

重启xinted 服务,并查看NRPE 是否已经启动
# service xinetd restart
可以看到5666端口已经在监听了。
e. 测试NRPE是否则正常工作
使用上面在被监控机上安装的check_nrpe 这个插件测试NRPE 是否工作正常。
再查看nagios 目录就会发现有5个目录了
# ls /usr/local/nagios/
bin  etc  include  libexec  share

#cp  /usr/local/nagios/etc/nrpe.cfg /usr/local/nagios/etc/nrpe.cfgbak
#vi /usr/local/nagios/etc/nrpe.cfg    #command调用命令在此定义,类似zabbix的userparameter
allowed_hosts=127.0.0.1,192.168.0.83

nagios客户端启动
# /usr/local/nagios/bin/nrpe -c /usr/local/nagios/etc/nrpe.cfg -d
# lsof -i:5666
COMMAND   PID   USER   FD   TYPE DEVICE SIZE/OFF NODE NAME
nrpe    46216 nagios    4u  IPv4  47006      0t0  TCP *:5666 (LISTEN)
# ps -ef | grep nagios | grep -v grep
nagios    19634      1  0 06:39 ?        00:00:00 /usr/local/nagios/bin/nrpe -c /usr/local/nagios/etc/nrpe.cfg -d

# echo "/usr/local/nagios/bin/nrpe -c /usr/local/nagios/etc/nrpe.cfg -d" >>/etc/rc.local
# /usr/local/nagios/libexec/check_nrpe -H localhost
会返回当前NRPE的版本

f. check_nrpe 命令用法
# /usr/local/nagios/libexec/check_nrpe –h
Usage: check_nrpe -H <host> [-n] [-u] [-p <port>] [-t <timeout>] [-c <command>] [-a <arglist...>]
Options:
 -n         = Do no use SSL
 -u         = Make socket timeouts return an UNKNOWN state instead of CRITICAL
 <host>     = The address of the host running the NRPE daemon
 [port]     = The port on which the daemon is running (default=5666)
 [timeout]  = Number of seconds before connection times out (default=10)
 [command]  = The name of the command that the remote daemon should run
 [arglist]  = Optional arguments that should be passed to the command.  Multiple
              arguments should be separated by a space.  If provided, this must be
              the last option supplied on the command line.

g. 查看NRPE的监控命令
# cat /usr/local/nagios/etc/nrpe.cfg |grep -v "^#"|grep -v "^$"
log_facility=daemon
pid_file=/var/run/nrpe.pid
server_port=5666
nrpe_user=nagios
nrpe_group=nagios
allowed_hosts=127.0.0.1,192.168.0.83

dont_blame_nrpe=0
debug=0
command_timeout=60
connection_timeout=300
command[check_users]=/usr/local/nagios/libexec/check_users -w 5 -c 10
command[check_load]=/usr/local/nagios/libexec/check_load -w 15,10,5 -c 30,25,20
command[check_sda1]=/usr/local/nagios/libexec/check_disk -w 20% -c 10% -p /dev/sda1
command[check_zombie_procs]=/usr/local/nagios/libexec/check_procs -w 5 -c 10 -s Z
command[check_total_procs]=/usr/local/nagios/libexec/check_procs -w 150 -c 200

红色部分是命令名,也就是check_nrpe 的-c 参数可以接的内容,等号 “=” 后面是实际执行的插件程序(这与commands.cfg 中定义命令的形式十分相似,只不过是写在了一行)。
也就是说check_users 就是等号后面/usr/local/nagios/libexec/check_users -w 5 -c 10 的简称。
我们可以很容易知道上面这5行定义的命令分别是检测登陆用户数,cpu负载,sda1的容量,僵尸进程,总进程数。各条命令具体的含义见插件用法(执行“插件程序名 –h”)。
由于-c 后面只能接nrpe.cfg 中定义的命令,也就是说现在我们只能用上面定义的这五条命令。我们可以在本机实验一下。
#/usr/local/nagios/libexec/check_nrpe -H localhost -c check_users
USERS OK - 1 users currently logged in |users=1;5;10;0
#/usr/local/nagios/libexec/check_nrpe -H localhost -c check_load
OK - load average: 0.00, 0.00, 0.00|load1=0.000;15.000;30.000;0; load5=0.000;10.000;25.000;0; load15=0.000;5.000;20.000;0;
配置监控
[root@node83 objects]# vi /usr/local/nagios/etc/objects/hosts.cfg #定义监控节点,即监控节点的增加与删除
define host{ use linux-server #引用templates.cfg定义的linux-server的属性(可在其中实现定制) host_name node84 #主机名 alias node84 #主机别名 address 192.168.0.84 #被监控的主机地址,这个地址可以是ip,也可以是域名。 } #增加节点就在这地方,复制上述内容就可以
define host {
use linux-server
host_name node85
alias node85
address 192.168.0.85
}
define host {
use linux-server
host_name node86
alias node86
address 192.168.0.86
}
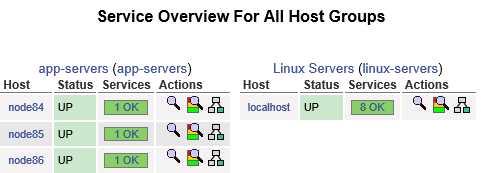
效果如图
define hostgroup{ hostgroup_name app-servers #主机组名称,可以随意指定。 alias app servers #主机组别名 members node84,node85,node86 #主机组成员,其中“Nagios-Linux”就是上面定义的主机。逗号隔开 }
效果如图
其他参数(一般定义在模板中) max_check_attempt 3 #故障后,最大尝试次数 normal_check_interval 2 #正常后重试间隔,分钟 retry_check_interval 2 #故障后重试间隔,分钟 check_period 24*7 #检查时间段 notification_interal 300 #故障后两次告警通知间隔时间,分钟 notification_period 24*7 #通知时间段 notification_option d,u,r #通知选项,服务是 wucr contact_groups admins # 通知人 root@node83 objects]# vi /usr/local/nagios/etc/objects/services.cfg #定义监控项 define service{ use local-service #引用local-service服务的属性,local-service在templates.cfg定义件中进行了定义。 host_name node84,node85,node86 #在哪个主机上的服务,Nagios-Server在hosts.cfg中进行了定义。 service_description check-host-alive #对监控服务内容的描述,以供维护人员参考。 check_command check-host-alive #指定检查的命令。 }
nagios client npre 配置文件中默认配置了如下命令定义,进行配置到services.cfg中去
command[check_users]=/usr/local/nagios/libexec/check_users -w 5 -c 10
command[check_load]=/usr/local/nagios/libexec/check_load -w 15,10,5 -c 30,25,20
command[check_sda1]=/usr/local/nagios/libexec/check_disk -w 20% -c 10% -p /dev/sda1
command[check_zombie_procs]=/usr/local/nagios/libexec/check_procs -w 5 -c 10 -s Z
command[check_total_procs]=/usr/local/nagios/libexec/check_procs -w 150 -c 200
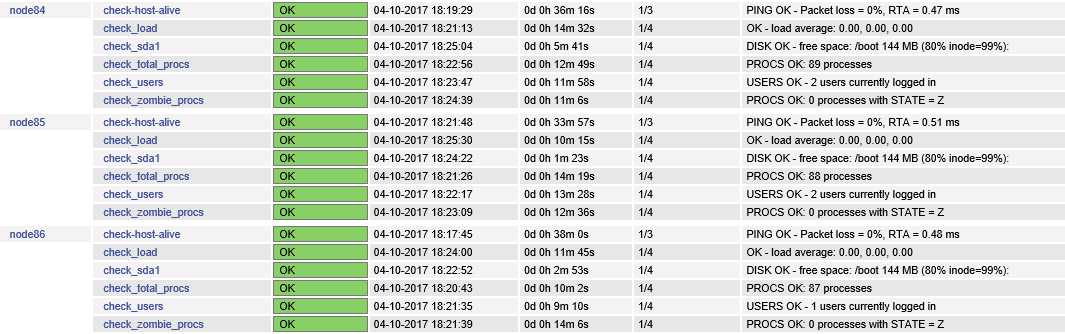
define service{
        use                     local-service
        host_name               node84,node85,node86
        service_description     check_users
        check_command           check_nrpe!check_users
        }

define service{
        use                     local-service
        host_name               node84,node85,node86
        service_description     check_load
        check_command           check_nrpe!check_load
        }

define service{
        use                     local-service
        host_name               node84,node85,node86
        service_description     check_sda1
        check_command           check_nrpe!check_sda1
        }

define service{
        use                     local-service
        host_name               node84,node85,node86
        service_description     check_zombie_procs
        check_command           check_nrpe!check_zombie_procs
        }

define service{
        use                     local-service
        host_name               node84,node85,node86
        service_description     check_total_procs
        check_command           check_nrpe!check_total_procs
        }

效果如图
如何完整的去定义一个check_nrpe监控项示例,监控swap情况,
1、得到插件帮助
# /usr/local/nagios/libexec/check_swap --help
Usage:
check_swap [-av] -w <percent_free>% -c <percent_free>%
-w <bytes_free> -c <bytes_free>
2、本机测试
# /usr/local/nagios/libexec/check_swap -w 20% -c 10%
SWAP OK - 100% free (999 MB out of 999 MB) |swap=999MB;199;99;0;999
3、在nrpe配置文件中定义
# echo "command[check_swap]=/usr/local/nagios/libexec/check_swap -w 20% -c 10%" >> /usr/local/nagios/etc/nrpe.cfg
==>重启nrpe,之后在nagis server端进行配置
1、从server端验证check nrpe执行情况
# /usr/local/nagios/libexec/check_nrpe -H 192.168.0.84 -c check_swap
SWAP OK - 100% free (999 MB out of 999 MB) |swap=999MB;199;99;0;999
2、定义监控项
# vi /usr/local/nagios/etc/objects/services.cfg
define service{
use local-service
host_name node84
service_description check_swap
check_command check_nrpe!check_swap
}
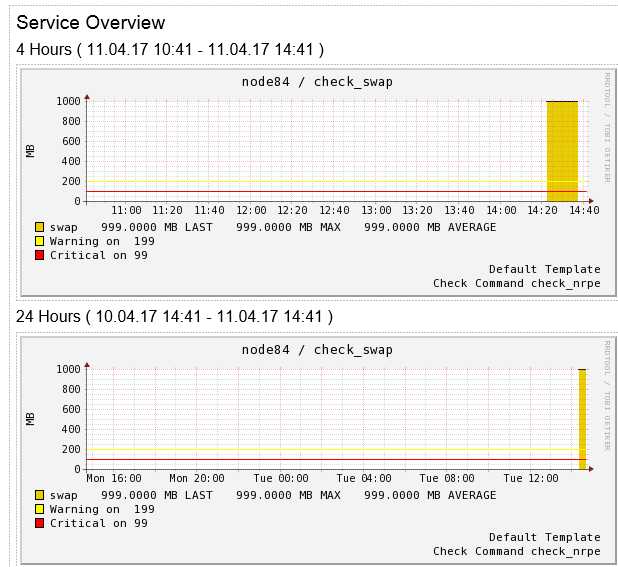
#进行语法检查及reload nagios 服务,并从平台查看
#/usr/local/nagios/bin/nagios -v /usr/local/nagios/etc/nagios.cfg
#/etc/init.d/nagios reload #重启nagios服务
![]()
如何完整的去定义一个主动探测监控项示例,监控port情况
# /usr/local/nagios/libexec/check_tcp --help
Usage:
check_tcp -H host -p port [-w <warning time>] [-c <critical time>] [-s <send string>]
[-e <expect string>] [-q <quit string>][-m <maximum bytes>] [-d <delay>]
[-t <timeout seconds>] [-r <refuse state>] [-M <mismatch state>] [-v] [-4|-6] [-j]
[-D <warn days cert expire>[,<crit days cert expire>]] [-S <use SSL>] [-E]
# /usr/local/nagios/libexec/check_tcp -H 192.168.0.84 -p 80
TCP OK - 0.000 second response time on 192.168.0.84 port 80|time=0.000269s;;;0.000000;10.000000
# vi /usr/local/nagios/etc/objects/services.cfg
define service{
use local-service
host_name node84
service_description check_tcp
check_command check_tcp!80 -w 2 -c 5 #这边的时间还要考虑nagios本身的interval_length
}
#进行语法检查及reload nagios 服务,并从平台查看
#/usr/local/nagios/bin/nagios -v /usr/local/nagios/etc/nagios.cfg
#/etc/init.d/nagios reload #重启nagios服务
配置邮件报警
#yum install sendmail -y
#service sendmail start
将root@node83.localdomain  加到qq邮箱白名单.因为nagios server以nagios用户发邮件,所以将root@node83.localdomain加到白名单
echo "hello world" | mail 87014247@qq.com
确认能收到邮件

定义联系人
# vi /usr/local/nagios/etc/objects/contacts.cfg
define contact{
contact_name     gtms
use       generic-contact
alias        Nagios Admin
email        87014247@qq.com
}

define contactgroup{
        contactgroup_name       oper
        alias                   oper
        members                gtms
}

增加联系人信息
# vi /usr/local/nagios/etc/objects/services.cfg
define service{
        use                     generic-service
        host_name               node84
        service_description     check_tcp
        check_command           check_tcp!80 -w 2 -c 4
        contact_groups       oper
        }


重载nagios测试成功
PNP出图设置
PNP出图
1、安装图形依赖库
yum install cairo cairo-devel zlib zlib-devel libxml2-devel pango pango-devel libpng-devel freetype freetype-devel -y
yum install  libart_lgpl-devel -y
yum install  pcre pcre-devel -y
yum install  perl perl-devel -y


安装rrd-tool
http://oss.oetiker.ch/rrdtool/download.en.html
tar -xf rrdtool-1.5.1.tar.tar
cd rrdtool-1.5.1
./configure --prefix=/usr/local/rrdtool --disable-tcl --disable-python
make
make install

安装PNP
http://download.csdn.net/download/zhang_qing_chen/6959431
 tar zxvf pnp-0.4.13.tar.gz
 cd pnp-0.4.13
./configure --with-rrdtool=/usr/local/rrdtool/bin/rrdtool --with-perdata-dir=/usr/local/nagios/share/perfdata
WARNING忽略RRDs Perl Modules:                *** NOT FOUND ***(忽略)
make all
make install
make install-config
make install-init
#ll /usr/local/nagios/libexec/ | grep process
-rwxr-xr-x 1 nagios nagios  30151 May 21 19:06 process_perfdata.pl


配置出图
# vi /usr/local/nagios/etc/nagios.cfg +833
process_performance_data=1
host_perfdata_command=process-host-perfdata
service_perfdata_command=process-service-perfdata


#vi /usr/local/nagios/etc/objects/commands.cfg
define command{
        command_name    process-host-perfdata
        command_line    /usr/local/nagios/libexec/process_perfdata.pl
        }

define command{
        command_name        process-service-perfdata
        command_line     /usr/local/nagios/libexec/process_perfdata.pl
        }

# /usr/local/nagios/libexec/process_perfdata.pl报错
Can‘t locate Time/HiRes.pm in @INC (@INC contains: /usr/local/lib64/perl5 /usr/local/share/perl5 /usr/lib64/perl5/vendor_perl /usr/share/perl5/vendor_perl /usr/lib64/perl5 /usr/share/perl5 .) at /usr/local/nagios/libexec/process_perfdata.pl line 32.
BEGIN failed--compilation aborted at /usr/local/nagios/libexec/process_perfdata.pl line 32.
[root@test82 libexec]# /usr/local/nagios/libexec/process_perfdata.pl
Can‘t locate Time/HiRes.pm in @INC (@INC contains: /usr/local/lib64/perl5 /usr/local/share/perl5 /usr/lib64/perl5/vendor_perl /usr/share/perl5/vendor_perl /usr/lib64/perl5 /usr/share/perl5 .) at /usr/local/nagios/libexec/process_perfdata.pl line 32.
BEGIN failed--compilation aborted at /usr/local/nagios/libexec/process_perfdata.pl line 32.

# yum install perl-Time-HiRes解决
# /usr/local/nagios/libexec/process_perfdata.pl
dont try this as root

#/usr/local/nagios/bin/nagios -v /usr/local/nagios/etc/nagios.cfg
#/etc/init.d/nagios reload


打开图形datetime报错,通过设置php配置文件解决
Warning: date(): It is not safe to rely on the system‘s timezone settings
cp php.ini-production $dir/lib/php.ini
date.timezone=Asia/Shanghai   ;date.timezone =

趋势图出现乱码,解决办法
# yum install rrdtool-perl

nagios和pnp图整合
主机出图
action_url    /nagios/pnp/index.php?host=$HOSTNAME$
服务出图
action_url    /nagios/pnp/index.php?host=$HOSTNAME$&srv=$SERVICEDESC$
ps:也可以在模板中定义好

配置一个服务出图
define service{
        use                     local-service
        host_name               node84
        service_description     check_swap
        check_command           check_nrpe!check_swap
action_url      /nagios/pnp/index.php?host=$HOSTNAME$&srv=$SERVICEDESC$
}

点击趋势图
nagios4配置出图,点开趋势图报Hostname is not set的报错,可能是因为版本问题
,
标签:产生 解决 密码验证 splay 不同的 登陆 设备 ups timeout
原文地址:http://www.cnblogs.com/gtms/p/6687255.html