标签:bit 默认 legend ini 博客 一段 图表 流量 表示
Jpgraph是PHP图表类库,可以生成折线图、柱状图、大饼图等等统计图。如果你想使用PHP生成统计图来统计数据,使用它再方便不过啦。
如果说你要亲自使用GD库来写的话,那我只能膜拜大神啦(我不会哈哈哈)。
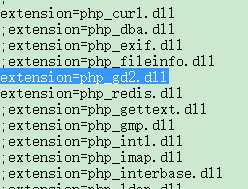
言归正传,首先你要确定你的PHP已经开启GD库啦,在php.ini配置文件中找到extension=php_gd2.dll确认没有被;注释。那表示已经开启GD库拉。
然后就可以去网上下一个Jpgraph的压缩包啦。解压保存到一个任意文件夹,之后会引用其中的文件,所以最好保存到一个你熟悉的文件夹。
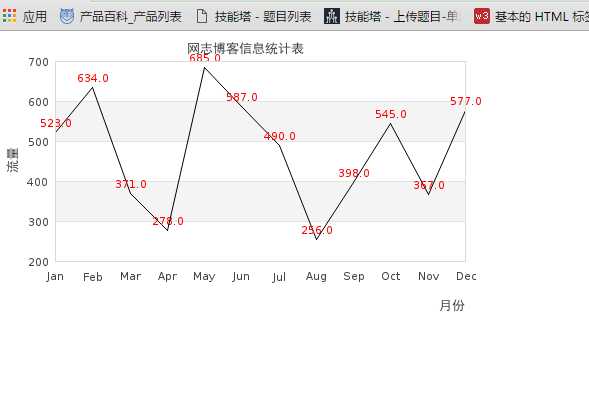
1)生成折线图
<?php

require_once ("jpgraph/src/jpgraph.php");
require_once ("jpgraph/src/jpgraph_line.php");

$data1 = array(523,634,371,278,685,587,490,256,398,545,367,577); //第一条曲线的数组

$graph = new Graph(500,300);
$graph->SetScale("textlin");
$graph->SetShadow();
$graph->img->SetMargin(60,30,30,70); //设置图像边距

$graph->graph_theme = null; //设置主题为null,否则value->Show(); 无效

$lineplot1=new LinePlot($data1); //创建设置两条曲线对象
$lineplot1->value->SetColor("red");
$lineplot1->value->Show();
$graph->Add($lineplot1);  //将曲线放置到图像上

$graph->title->Set(iconv("UTF-8","GB2312//IGNORE","网志博客信息统计表"));   //设置图像标题
$graph->xaxis->title->Set(iconv("UTF-8","GB2312//IGNORE","月份")); //设置坐标轴名称
$graph->yaxis->title->Set(iconv("UTF-8","GB2312//IGNORE","流量"));
$graph->title->SetMargin(10);
$graph->xaxis->title->SetMargin(10);
$graph->yaxis->title->SetMargin(10);

$graph->title->SetFont(FF_SIMSUN,FS_BOLD); //设置字体
$graph->yaxis->title->SetFont(FF_SIMSUN,FS_BOLD);
$graph->xaxis->title->SetFont(FF_SIMSUN,FS_BOLD);
$graph->xaxis->SetTickLabels($gDateLocale->GetShortMonth());

$graph->Stroke();  //输出图像
效果如图
2)柱状图
<?php
require_once ("jpgraph/jpgraph.php");
require_once ("jpgraph/jpgraph_bar.php");

$data  = array(19,23,34,38,45,67,71,78,85,87,96,145);
$ydata = array("一","二","三","四","五","六","七","八","九","十","十一","十二");

$graph = new Graph(500,300);  //创建新的Graph对象
$graph->SetScale("textlin");  //刻度样式
$graph->SetShadow();          //设置阴影
$graph->img->SetMargin(40,30,40,50); //设置边距

$graph->graph_theme = null; //设置主题为null,否则value->Show(); 无效

$barplot = new BarPlot($data);  //创建BarPlot对象
$barplot->SetFillColor(‘blue‘); //设置颜色
$barplot->value->Show(); //设置显示数字
$graph->Add($barplot);  //将柱形图添加到图像中

$graph->title->Set("CDN流量图");
$graph->xaxis->title->Set("月份"); //设置标题和X-Y轴标题
$graph->yaxis->title->Set("流 量(Mbits)");
$graph->title->SetColor("red");
$graph->title->SetMargin(10);
$graph->xaxis->title->SetMargin(5);
$graph->xaxis->SetTickLabels($ydata);

$graph->title->SetFont(FF_SIMSUN,FS_BOLD);  //设置字体
$graph->yaxis->title->SetFont(FF_SIMSUN,FS_BOLD);
$graph->xaxis->title->SetFont(FF_SIMSUN,FS_BOLD);
$graph->xaxis->SetFont(FF_SIMSUN,FS_BOLD);

$graph->Stroke();
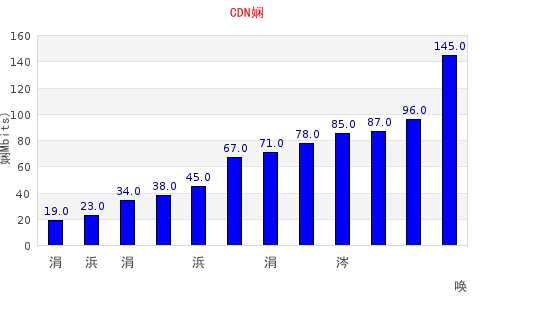
效果如图
3)大饼图
require_once ("jpgraph/src/jpgraph.php");
require_once ("jpgraph/src/jpgraph_pie.php");
require_once ("jpgraph/src/jpgraph_pie3d.php");

$data = array(19,23,34,38,45,67,71,78,85,87,90,96);

$graph = new PieGraph(550,500);
$graph->SetShadow();

$graph->title->Set("CDN流量比例");
$graph->title->SetFont(FF_SIMSUN,FS_BOLD);

$pieplot = new PiePlot3D($data);  //创建PiePlot3D对象
$pieplot->SetCenter(0.4, 0.5); //设置饼图中心的位置
$pieplot->SetLegends($gDateLocale->GetShortMonth()); //设置图例

$graph->Add($pieplot);
$graph->Stroke();
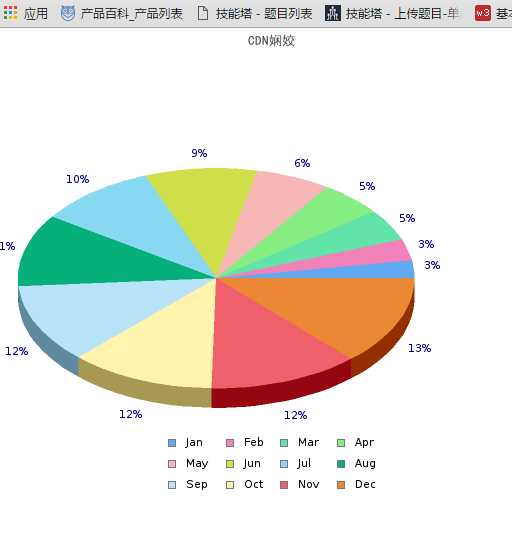
效果如图
不知道各位看官发现没有,貌似柱状图和大饼图的文字不是正常的中文。折线图倒是正确的,这是因为Jpgraph默认把字符串转换为UTF8格式的,如果你的文件php文件本身就是UTF8格式那么久相当于转换了2次,所以产生了乱码。
这里就要用到转换编码方式 iconv("UTF-8","gb2312",$x);需要先把汉字编码转化为gb2312,这样汉字才能正常显示。参考第一段代码写法就行。
下面附上更详细的介绍博客地址(感谢技术分享):http://blog.csdn.net/aoshilang2249/article/details/46956163
&& http://w3note.com/web/181.html && http://blog.csdn.net/liupengcheng201/article/details/44593713
标签:bit 默认 legend ini 博客 一段 图表 流量 表示
原文地址:http://www.cnblogs.com/xionghao/p/6845514.html