标签:style blog http os java io for ar 数据
<!doctype html>
<html lang="en">
<head>
<meta charset="UTF-8">
<title>Simple Graph</title>
<style type = "text/css">
body{ font: 12px Arial;}
path{
stroke: steelblue;
stroke-width: 2;
fill: none;
}
.axis path,
.axis line{
fill: none;
stroke: grey;
stroke-width: 1;
shape-rendering: crispEdges;
}
.grid .tick {
stroke: lightgrey;
opacity: 0.7;
}
.grid path {
stroke-width: 0;
}
.area{
fill: lightsteelblue;
stroke-width: 0;
}
</style>
<script type="text/javascript" src="d3.v3.min.js"></script>
</head>
<body>
<script type="text/javascript">
var margin = {top:30, right:20, bottom: 30, left: 50};
width = 600 - margin.left -margin.right;
height = 270 - margin.top - margin.bottom;
//为了将数据中时间转化为D3需要的样式
var parseDate = d3.time.format("%d-%b-%y").parse;
var x = d3.time.scale().range([0, width]);
var y = d3.scale.linear().range([height, 0]);
//ticks只是你建议的,真正画图时,D3会自己决定这个应该分为几个刻度。
var xAxis = d3.svg.axis().scale(x).orient("bottom").ticks(5);
var yAxis = d3.svg.axis().scale(y).orient("left").ticks(5);
var valueline = d3.svg.line()
.x(function(d){return x(d.date);})
.y(function(d){return y(d.close);});
var svg = d3.select("body")
.append("svg")
.attr("width", width + margin.left + margin.right)
.attr("height", height + margin.top + margin.bottom)
.append("g")
.attr("transform", "translate(" + margin.left + "," + margin.top + ")");
//这是划线需要的,可以有很多的模式,monotone,basic。。。想要更改不同样式的同学可以在网上找找。
var valueline = d3.svg.line()
.interpolate("monotone")
.x(function(d){return x(d.date);})
.y(function(d){return y(d.close);});
//这是自己写的死数据
//Get the data
var data_ = [
{date:parseDate("1-May-12"),close:582.13},
{date:parseDate("30-Apr-12"),close:100.98},
{date:parseDate("27-Apr-12"),close:603.00},
{date:parseDate("26-Apr-12"),close:100.70},
{date:parseDate("25-Apr-12"),close:610.00},
{date:parseDate("24-Apr-12"),close:100.28},
{date:parseDate("23-Apr-12"),close:571.70},
{date:parseDate("20-Apr-12"),close:100.98},
{date:parseDate("19-Apr-12"),close:587.44},
{date:parseDate("18-Apr-12"),close:100.34},
{date:parseDate("17-Apr-12"),close:609.70},
{date:parseDate("16-Apr-12"),close:100.13}
]
//Scale(规模) the range of the data
x.domain(d3.extent(data_, function(d){
return d.date;
}));
y.domain([0, d3.max(data_, function(d){
return d.close;
})]);
//Add the valueline path
svg.append("path")
.attr("d", valueline(data_));
//Add the X Axis
svg.append("g")
.attr("class", "x axis")
.attr("transform", "translate(0," + height + ")")
.call(xAxis);
//Add the Y Axis
svg.append("g")
.attr("class", "y axis")
.call(yAxis);
</script>
</body>
</html>
这是最基本的一个图表,有横坐标,纵坐标。
效果如下:
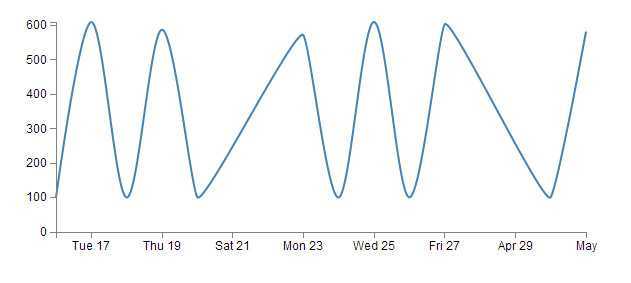
这是最基本的图形,x轴,y轴,对应的数据形式是JSON类型,更多的可以参照D3官网: http://d3js.org/
标签:style blog http os java io for ar 数据
原文地址:http://www.cnblogs.com/sm-hl/p/3929832.html