标签:lca lines 图像处理 between 添加 images import ilo href
坐标轴调节以及刻度调节参见:『Python』PIL&plt图像处理_矩阵转化&保存图清晰度调整
数据生成:
 1 import numpy as np
 2 import matplotlib.pyplot as plt
 3
 4 func = np.poly1d(np.array([1,2,3,4]))
 5 func1 = func.deriv(m=1)                 # 求一阶导数
 6 func2 = func.deriv(m=2)                 # 求二阶导数
 7
 8 x = np.linspace(-10,10,30)
 9 y = func(x)
10 y1 = func1(x)
11 y2 = func2(x)
1 ‘‘‘正常绘图‘‘‘
2
3 plt.plot(x,y,‘ro‘,x,y1,‘g--‘)
4 plt.xlabel(‘x‘)
5 plt.ylabel(‘y‘)
6 plt.show()
 1 ‘‘‘添加子图‘‘‘
 2
 3 plt.subplot(311)
 4 plt.plot(x,y,c=‘r‘,linestyle=‘-‘)
 5 plt.title(‘Polynomial‘)
 6
 7 plt.subplot(312)
 8 plt.plot(x,y1,c=‘b‘,linestyle=‘‘,marker=‘^‘)
 9 # plt.plot(x,y1,‘b^‘)
10 plt.title(‘First Derivative‘)
11
12 plt.subplot(313)
13 plt.plot(x,y2,c=‘g‘,linestyle=‘‘,marker=‘o‘)
14 plt.title(‘Second Derivative‘)
1 ‘‘‘对数坐标‘‘‘
2
3 plt.semilogx(x,y)  # 对x取对数
4 plt.semilogy(x,y)  # 对y取对数
5 plt.loglog(x,y)    # 同时取对数
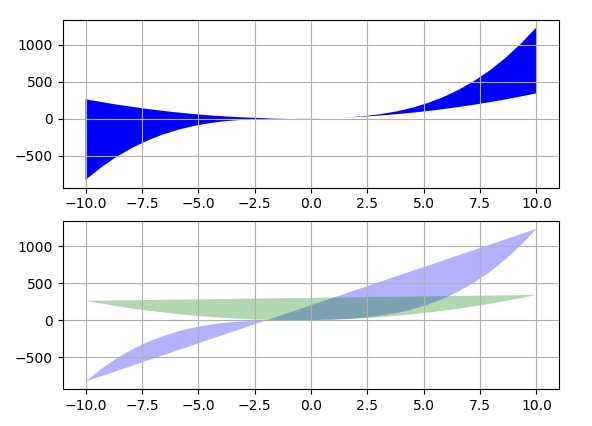
 1 ‘‘‘颜色填充‘‘‘
 2
 3 fig = plt.figure()
 4
 5 ax = fig.add_subplot(211)
 6 ax.fill_between(x,y,y1,facecolor=‘b‘)
 7 ax.grid(True)
 8
 9 ax2 = fig.add_subplot(212)
10 ax2.fill(x,y,facecolor=‘b‘,alpha=0.3)
11 ax2.fill(x,y1,facecolor=‘g‘,alpha=0.3)
12 ax2.grid(True)
13 # plt.show()

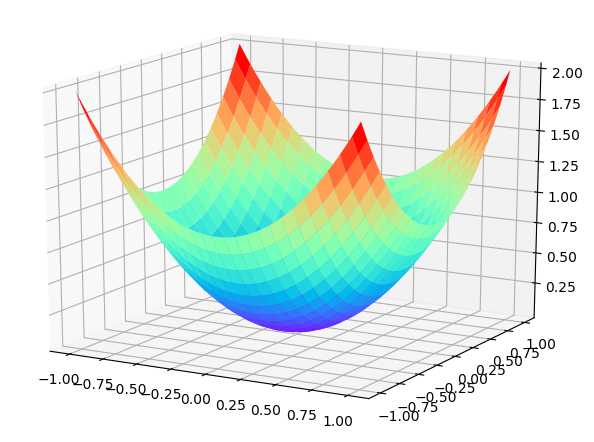
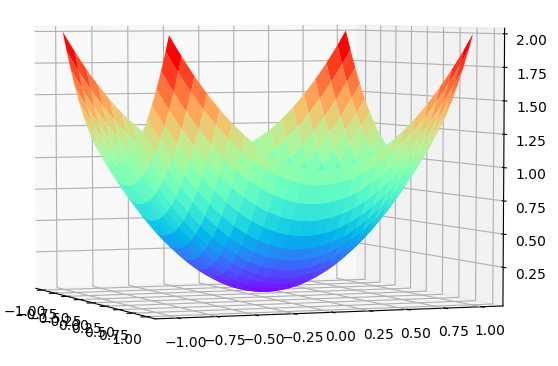
 1 ‘‘‘三维绘图‘‘‘
 2
 3 from mpl_toolkits.mplot3d import Axes3D
 4
 5 u = np.linspace(-1,1,100)
 6 x,y = np.meshgrid(u,u)     # 网格坐标生成函数
 7 z = x**2+y**2
 8
 9 fig = plt.figure()
10 ax = Axes3D(fig)
11 # cmap = color_map,另外两个参数是瓦片步长
12 ax.plot_surface(x,y,z,rstride=4,cstride=4,cmap=‘rainbow‘)


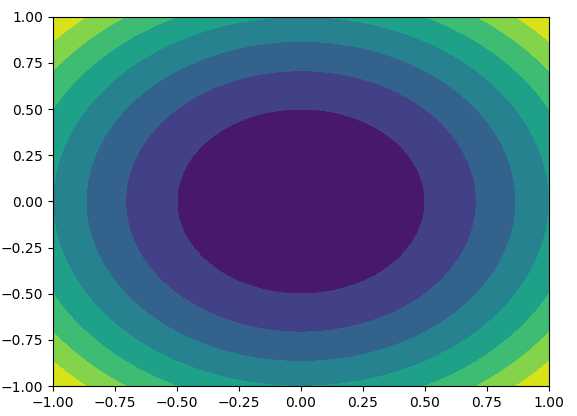
 1 ‘‘‘三维绘等高线图‘‘‘
 2
 3 u = np.linspace(-1,1,100)
 4 x,y = np.meshgrid(u,u)     # 网格坐标生成函数
 5 z = x**2+y**2
 6
 7 fig = plt.figure()
 8 ax = fig.add_subplot(111)
 9 ax.contourf(x,y,z)
10 plt.show()

『Python』Numpy学习指南第九章_使用Matplotlib绘图
标签:lca lines 图像处理 between 添加 images import ilo href
原文地址:http://www.cnblogs.com/hellcat/p/6882832.html