标签:rss 系统信息 逗号 重要 dash wap smp ext command
第9章:Shell脚本进程管理
9.1、进程概念
理解进程概念需要先简单了解指令和程序这两个概念,进程跟指令和程序是相关联的。
什么叫指令?
指令是指示计算机执行某种操作的命令,它由一串二进制数码组成。
什么叫程序?
程序(Program)是实现计算机执行一个或多个操作,或执行某一任务,按序设计的计算机指令的集合。
什么叫进程?
进程是正在运行的程序的实例,进程也是执行程序的具体实现过程。
指令、程序和进程三者之间的关系?
计算机实际上可以做的事情实质上非常简单,比如计算两个数的和,再比如在内存中寻找到某个地址等等。这些最基础的计算机动作被称为指令 (instruction)。
所谓的程序(program),就是这样一系列指令的所构成的集合。通过程序,我们可以让计算机完成复杂的操作。但是程序大多数时候被存储为可执行的文件,程序是静态存在的,并不会直接执行。
所谓的进程是程序的一个具体实现的过程,进程是动态存在的,程序的实现需要依靠进程执行才能完成这一系列指令集合的操作。同一个程序可以执行多次,每次都可以在内存中开辟独立的空间来装载,从而产生多个进程。不同的进程还可以拥有各自独立的IO接口。
9.2、进程收集(ps静态显示、top动态显示)
列出进程中最重要的命令便是进程状态命令ps和命令top,进程命令ps 只能静态显示,而top命令能动态显示进程。PID为进程ID值,此数字是定义进程的唯一值。PPID为父进程ID值,一般为创建子进程的进程。每一个父进程都会有零个或多个子进程,进程的形式为树状结构。进程编号0通常称为kernel、sched或swapper,所以,在某些系统上并不会显示在ps的输出结果中。进程编号1比较特殊,称为init。
9.2.1、ps命令
ps形式发展出主要有两种:System V式和BSD式:
[root@cloucentos6 ~]# ps –efl #System V形式
F S UID PID PPID C PRI NI ADDR SZ WCHAN STIME TTY TIME CMD
4 S root 1 0 0 80 0 - 4811 poll_s May18 ? 00:00:01 /sbin/init
1 S root 2 0 0 80 0 - 0 kthrea May18 ? 00:00:00
[kthreadd]
[root@cloucentos6 ~]# ps aux #BSD风格,通常使用这类形式
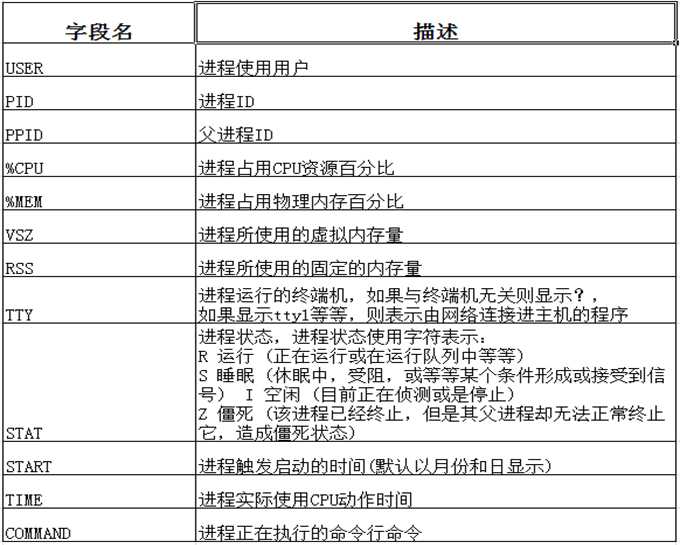
USER PID %CPU %MEM VSZ RSS TTY STAT START TIME COMMAND
root 1 0.0 0.0 19244 1420 ? Ss May18 0:01 /sbin/init
root 2 0.0 0.0 0 0 ? S May18 0:00 [kthreadd]
范例1:以ps aux命令显示进程相关详细信息
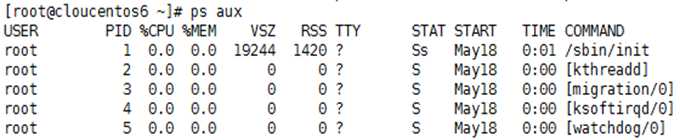
其中第一行每个字段相关信息描述:
范例2:-o选项参数以逗号操作符(,)作为定界符,一般与-e选项一起使用,-e功能等同于-A选择所有进程。
[root@cloucentos6 ~]# ps -eo pid,ppid,pcpu,comm | head -n 5
PID PPID %CPU COMMAND
1 0 0.0 init
2 0 0.0 kthreadd
3 2 0.0 migration/0
4 2 0.0 ksoftirqd/0
范例3:选择分类显示,并且grep获取包含sshd相关信息的进程
[root@cloucentos6 ~]# ps -eo pid,ppid,pcpu,comm | grep -E "bash|PPID"
PID PPID %CPU COMMAND
4418 4416 0.0 bash
4438 4433 0.0 bash
4906 4438 0.0 bash
[root@cloucentos6 ~]# ps aux | grep -E "bash|PPID"
root 4418 0.0 0.0 108380 1832 pts/0 Ss+ May19 0:00 /bin/bash -l
root 4438 0.0 0.0 108380 1868 pts/1 Ss May19 0:00 -bash
root 4904 0.0 0.0 103160 832 pts/1 S+ 01:24 0:00 grep -E bash|PPID
范例4:选择分类显示,以pcpu从大到小升序排列
[root@cloucentos6 ~]# ps -eo pid,ppid,pcpu,comm --sort -pcpu | head -n5
PID PPID %CPU COMMAND
1 0 0.0 init
2 0 0.0 kthreadd
3 2 0.0 migration/0
4 2 0.0 ksoftirqd/0
9.2.2、top命令
top命令是Linux下常用的性能分析工具,能够实时显示系统中各个进程的资源占用状况,类似于Windows的任务管理器。
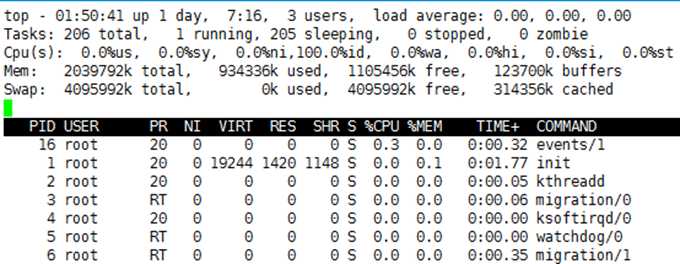
其中进程上面各项描述:
top - 01:54:09 [当前系统时间],
up 1 day [系统已经运行了16天],
3 user [3个用户当前登录],
load average: 0.00, 0.00, 0.0 [系统负载,即任务队列的平均长度]
Tasks: 206 total [总进程数],
1 running [正在运行的进程数],
205 sleeping [睡眠的进程数],
0 stopped [停止的进程数],
0 zombie [冻结进程数],
Cpu(s): 0.0%us [用户空间占用CPU百分比],
0.0%sy [内核空间占用CPU百分比],
0.0%ni [用户进程空间内改变过优先级的进程占用CPU百分比],
100.0%id [空闲CPU百分比],
0.0%wa [等待输入输出的CPU时间百分比],
0.0%hi [硬件CPU中断占用百分比]
0.0%st [软中断占用百分比]
0.0%st [虚拟机占用百分比]
Mem: 2039792k total [物理内存总量],
934204k use [使用的物理内存总量],
1105588k free [空闲内存总量],
123700k buffers [用作内核缓存的内存量]
Swap: 4095992k total [交换区总量],
0k used [使用的交换区总量],
4095992k free [空闲交换区总量],
314356k cached [缓冲的交换区总量]
Top常用操作:
top #每隔5秒显式所有进程的资源占用情况
top -d 2 #每隔2秒显式所有进程的资源占用情况
top -c #每隔5秒显式进程的资源占用情况,并显示进程的命令行参数(默认只有进程名)
top -p 128 -p 138 #每隔5秒显示pid是128和pid是138的两个进程的资源占用情况
top -d 2 -c -p 128 #每隔2秒显示pid是128的进程的资源使用情况,并显式该进程启动的命令行参数
9.2.3、结束进程
范例1:kill和killall命令使用
[root@cloucentos6 ~]# kill –l #打印信号数和信号名称
SIGHUP 1 对控制进程或终端进行挂起检测
SIGINT 2 当按下Ctrl + C时发送该信号
SIGKILL 9 用于强行杀死进程
SIGTERM 15 默认用于终止进程
SIGTSTP 20 当按下Ctrl+Z进发送该信号
[root@ssticentos65 home]# ps -eo comm,pid,ppid | grep ssh #查看ssh进程
sshd 67184 1
sshd 67192 67184
[root@ssticentos65 ~]# ps aux | grep sshd #查看ssh进程详细
root 67184 0.0 0.0 66628 1236 ? Ss 11:56 0:00 /usr/sbin/sshd
root 67192 0.2 0.2 100388 4236 ? Ss 11:56 0:00 sshd: root@pts/1
root 67235 0.0 0.0 103256 840 pts/1 R+ 11:57 0:00 grep sshd [root@ssticentos65 home]# kill -9 67184 #通过PID使用 -9 强制杀死进程
[root@ssticentos65 ~]# killall -9 sshd #通过命令名称使用 -9 强制杀死进程
[root@ssticentos65 ~]# killall -9 root sshd #通过指定所属用户和命令名称使用-9强制杀死进程
范例2:pkill命令踢出登录用户
[root@ssticentos65 ~]# w
14:11:56 up 1 day, 18:53, 3 users, load average: 0.00, 0.06, 0.26
USER TTY FROM LOGIN@ IDLE JCPU PCPU WHAT
root tty1 :0 Wed19 42:52m 37.66s 37.66s /usr/bin/Xorg :0 -nr -verbose -audit 4 -a
root pts/0 :0.0 Wed19 1:53 0.24s 0.24s /bin/bash
root pts/1 10.8.9.11 14:10 1.00s 0.24s 0.04s w
[root@ssticentos65 ~]# pkill -kill -t pts/0
9.2.4、which、whereis、file、whatis与平均负载
范例1:which找出某个命令具体位置
[root@ssticentos65 ~]# which ls #找出ls命令所以位置
alias ls=‘ls --color=auto‘
/bin/ls
范例2:whereis和which命令类似,但它不仅返回命令的路径 ,还能够打印出命令手册位置和命令源代码路径
[root@ssticentos65 ~]# whereis ls
ls: /bin/ls /usr/share/man/man1/ls.1.gz /usr/share/man/man1p/ls.1p.gz
范例3:file命令确定文件的类型
[root@ssticentos65 home]# ls -l
total 24
-rw-r--r-- 1 root root 188 May 4 17:01 list
drwx------. 2 root root 16384 Jan 5 01:59 lost+found
drwxr-xr-x 2 root root 4096 May 5 14:19 test
[root@ssticentos65 home]# file test
test: directory
[root@ssticentos65 home]# file list
list: Bourne-Again shell script text executable
[root@ssticentos65 home]# whatis ls #命令简短描述信息
ls (1) - list directory contents
ls (1p) - list directory contents
9.2.5、收集系统信息
范例:
[root@cloucentos6 ~]# hostname #打印系统主机名
cloucentos6.0
[root@cloucentos6 ~]# uname –n #打印系统主机名
cloucentos6.0
[root@cloucentos6 ~]# uname –a #打印Linux内核版本、硬件架构等详细信息
Linux cloucentos6.0 2.6.32-71.el6.x86_64 #1 SMP Fri May 20 03:51:51 BST 2011 x86_64 x86_64 x86_64 GNU/Linux
[root@cloucentos6 ~]# uname –r #打印内核发行版本
2.6.32-71.el6.x86_64
[root@cloucentos6 ~]# uname -m #打印主机类型
x86_64
[root@cloucentos6 ~]# cat /proc/cpuinfo #打印出CPU的相关信息
[root@cloucentos6 ~]# cat /proc/meminfo #打印出内存相关系统
[root@cloucentos6 ~]# cat /proc/partitions #打印出系统分区信息
[root@cloucentos6 ~]# fdisk –l #打印出系统分区信息
9.2.6、使用/proc收集信息
/proc是一个位于内存中的伪文件系统,它的引入是为了提供一个可以从用户空间读取系统参数的接口,我们能够从中收集到大量的系统信息。系统中每一个运行的进程在/proc中都有一个对应的目录,进程的目录名和进程PID相同。
范例:
[root@cloucentos6 /]# ps aux | grep bash
root 2529 0.0 0.0 108212 1840 pts/0 Ss+ Feb14 0:00 /bin/bash -l
root 31077 0.0 0.1 108452 2056 pts/1 Ss Feb15 0:00 -bash
root 33096 0.0 0.0 103160 836 pts/1 S+ 19:44 0:00 grep bash
[root@cloucentos6 /]# ls /proc/2529/
attr coredump_filter fd maps net personality smaps syscall
auxv cpuset fdinfo mem numa_maps root stack task
cgroup cwd io mountinfo oom_adj sched stat wchan
clear_refs environ limits mounts oom_score schedstat statm
cmdline exe loginuid mountstats pagemap sessionid status
[root@cloucentos6 /]# cat /proc/2529/environ #可以显示所有传递给该进程的环境变量
9.2.7、用cron进行调度
cron利用的是一个被称为”cron表”的文件也是一个任务调度工具,这个文件中存储了需要执行的脚本或命令的调度以及执行时间。
cron表的每一个条目都由6部分组成:
1、分钟(0~59)
2、小时(0~23)
3、天(1~31)
4、月份(1~12)
5、工作日(0~6)
6、命令(脚本或命令)
格式如下:
1 2 3 4 5 6
* * * * * /home/test.sh
分 时 天 月 日 命令或脚本
范例:
[root@cloucentos6 /]# crontab –e # -e 输入cron作业,会默认打开文本编辑器(通常是vi)
[root@cloucentos6 /]# crontab –l # -l 查看cron作业
02 02 * * * /home/test.sh
[root@cloucentos6 /]# crontab –r #移除当前用户cron作业
[root@cloucentos6 /]# crontab -u user –r #移除其它用户cron作业
标签:rss 系统信息 逗号 重要 dash wap smp ext command
原文地址:http://www.cnblogs.com/zoulongbin/p/6891010.html