Introduction
One of the more interesting things for any person is to see how the internal engines from the server software work. The purpose of this article is to show how we can apply basic assembler knowledge to find interesting runtime information.
Few days ago, my friend was involved on PHP+MYSQL site development. He was experiencing some issues.
Ok, we can start.
- You will need MySQL installation download and install any version of MySQL. Please make sure that your MySQLD service is running successfully (In other words, ensure that your MySQL is working properly).
- Download the latest version of Windbg for Windows from the Microsoft site.
- Launch Windbg.
- Press F6 and attach the mysqld.exe process.
- Set the Windbg symbols properly by using File->Symbols File Path:srv*c:\windows*http://msdl.microsoft.com/download/symbols.
- On Windbg command line, execute
.reload. - Press F5 to run the process (When you attach the process, this gets frozen). Using F5 or with G command, the process runs.
- Here is the tricky part. MYSQLD.exe process (or service in this case) is in charge of executing the SQL Queries from PHP pages, or MYSQL different clients. Navicat is a cool MYSQL client which allows us to see the MYSQL Server in a graphical mode, like Microsoft Management Studio does with SQL Server.
- Let‘s start navicat tool for educative purposes (if you want), or use your own PHP or any other application which is a MYSQL Client.
EXECUTEis the magic word. The tricky part is: Why if MYSQLD.EXE process performs a SQL Query executing any kind ofEXECUTEfunction on any part of their internal code? Let‘s put a breakpoint there.- Breakpoint: Stop the current
MYSQLDExecution by CTRL+Break on Windbg and put the following command:bm *mysqld*!*execute*(BM=break on mask, library all *mysqld* and function *execute*). - Press F5 and perform any client operation with PHP Page or Navicat or any other MYSQL client.
- You will see a freeze in your page or navicat: Why? Because MYSQLD was stopped. Lets see the windbg.

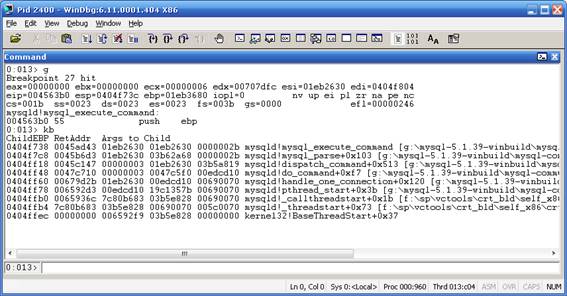
- Nice, the MYSQLD process stopped on
MYSQLD!MYSQL_EXECUTE_COMMAND, let‘s see the Stack Trace: Use KB command: - As you can see, you can observe directly the input parameters for
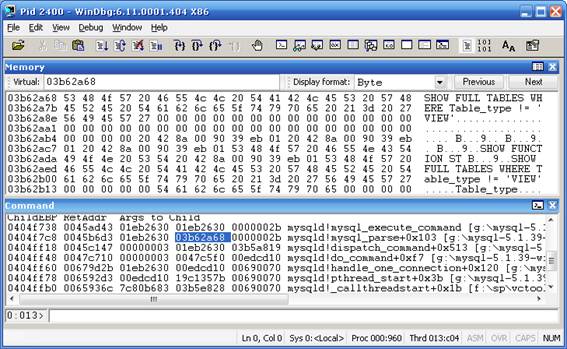
MYSQL_EXECUTE_COMMANDon Args to Child section. Every hexadecimal value there represents normally a pointer to any specified data structure. Is anystringthere on any of the Args to Child pointer? Let‘s examine this. - Click on View->Memory. On Address, write the Pointer (captured from Args to child) try with 01eb2630 and the other args to child:

- We did not see any interesting thing on all args to child parameters for
MYSQL_EXECUTE_COMMAND, but what about the previous function:mysql_parse?
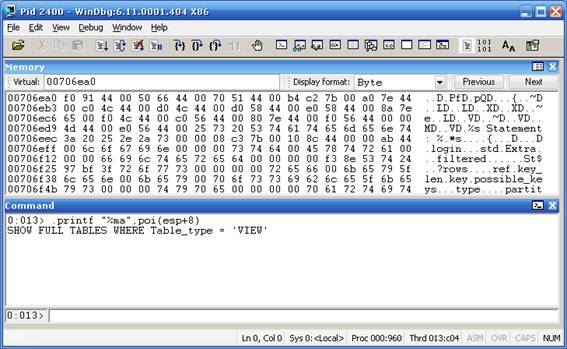
- Eureka! There is something interesting there. What if we print the value there? Let‘s execute:
.printf “%ma”.03b62a68:
- Yes, this is definitely a SQL Query captured from MYSQLD process. Now when we have the function that we want, delete all breakpoints by using the command
BC *and usebp mysqld!mysql_parseand continue the execution by using F5 or G windbg command line. - Now our windbg stopped on
mysqld!mysql_parse. - The one million question is: everytime that any MYSQL Query executes something, it will freeze my app until press F5 app? The answer is no, if we use a more intelligent breakpoint. We know the function
mysql_parse, but in which memory address it is stored? This is a call stack theory:
- Let‘s explain this, when the process is starting a function, it pushes the Function parameters to be used. Then what happens with ESP processor register? Example:
VOID SUM(INT X,INT *Y).ESPrepresents theTOPof the stack, andEBPthe base address for theStack. Let‘s assume thatESP=1000. - The process pushes the pointer to the
Yvalue andESPdecreases their value, decreases the top of the stack? Sounds confusing, Yes it‘strue, in the Windows operative system, theTOPof the stack is in the lower part of memory than EBP (Base pointer of the stack)ESP=ESP-4 : 996. - The process pushes the value of
X ESP=ESP-4 : 992. - The process push the return address for the previous function:
ESP=ESP-4 : 998. - When the Windbg stops, the stack is in the
cstate. For example, you can find the second parameter by just executing a simple math operation: 2o parameter is located in thePOI(ESP+8), as we can see the Windbg previous picture, YES, ourstringis the second parameter. Let‘s try this: - Printing the 2o parameter:
.printf “%ma”,poi(esp+8).
- Why POI? Poi in windbg represents or gets the pointer address of
ESP+8,%mameans or represent just a ASCII chars.%murepresents Unicode. - Good, now we can put together in a simple breakpoint.
- The complete breakpoint:
bp mysqld!mysql_parse ".printf \"\\n%ma\",poi(esp+8);gc" - When we set
Bp=breakpointin the functionmysqld!mysql_parse, it prints an ASCIIstringgiven a pointer to theesp+8(second parameter, andgcto continue the execution without stop.
License
