标签:state compute spec peter nec cli dial spi other
注意点:
In the Trace Properties dialog box, there is a checkbox option in the General tab with the caption Server processes trace data, to specify whether
trace data should be processed on the server. If not checked, trace data is processed at the client side.
When trace data is processed at the client side, it is possible for some events to be missed if the server load is high. If this option is checked, then trace
data is processed on the server and all the events included in trace definition are guaranteed to be captured without miss. However, this guarantee comes
with performance penalty, because processing trace data on server has an impact on the performance of SQL Server, and hence enabling this option is
not recommended on production server.
Also, running SQL Server Profiler on production server itself should be avoided as running SQL Server Profiler is resource consuming. Instead, you should run
SQL Server Profiler from a client computer and connect it to your SQL Server from there.
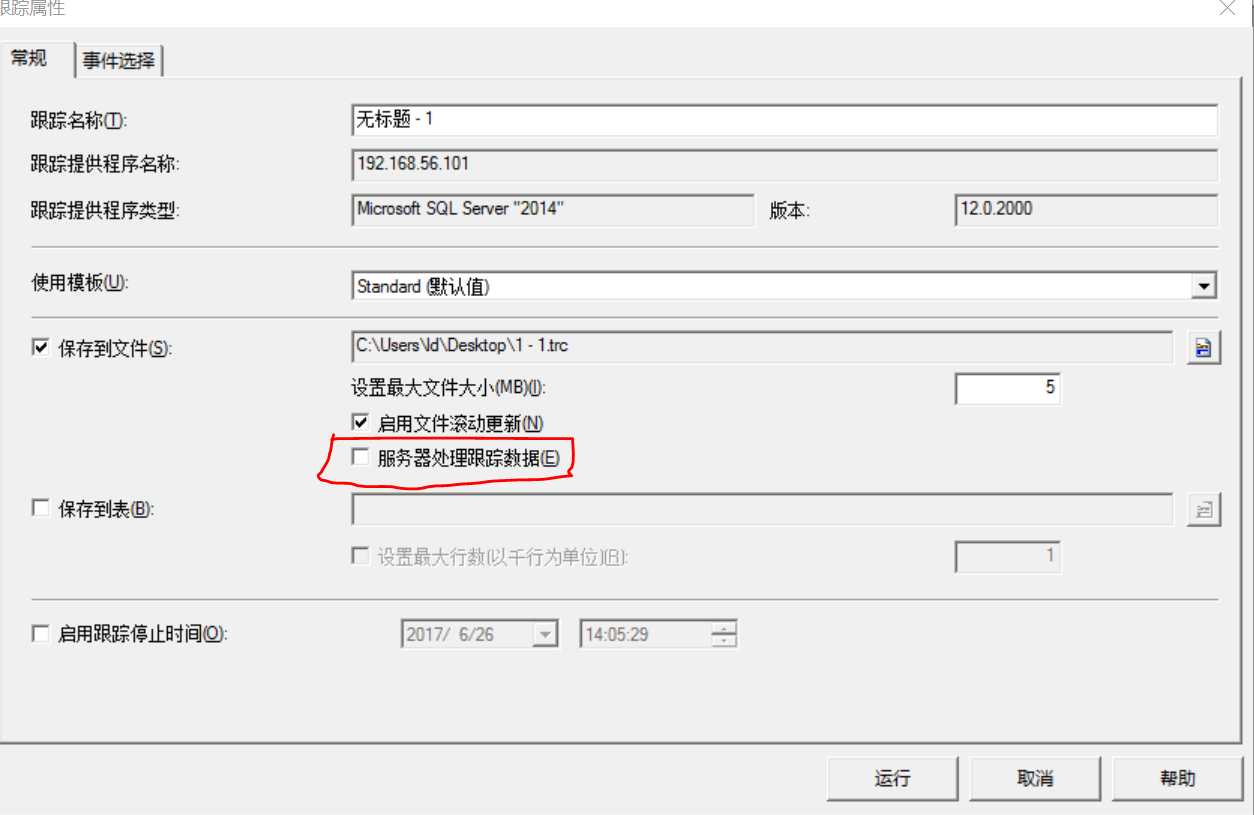
When large amount of event data is captured, the trace file can grow very quickly and become very large. Enabling the Enable file rollover option can prevent a trace file from becoming very large by limiting a file to the maximum file size specified. When the file size is reached to the maximum file size specified, SQL Server creates a new roll-over file with the same name appended with a suffix of an incremental number for the same trace. Thus, when we have this option enabled and the size of trace data is greater than maximum file, we have multiple trace files for the same trace.
It‘s best to store the trace file on a separate disk other than the one which is used to store data files and log files of SQL server databases. Storing the trace file on the same physical disk where database files are stored can degrade the performance of normal I/O operations of other databases.
提示
Configuring a trace by enabling the Save to table checkbox in the Trace Properties dialog box and saving trace data directly to trace table is less
efficient. If you want your trace data to be saved in a trace table then consider saving the trace data first in a trace file; then export your trace data from
trace file to trace table by opening the trace file in SQL Server Profiler and selecting the Save As command from the File menu with the Trace Table…
option. When you want to save your trace in a trace table, always consider to save your trace in a separate database.
SQL Profiler
SQL Server Profiler is a graphical user interface tool for working with SQL Trace. Behind the scene, it uses the same SQL Trace engine, but additionally provides graphical user interface to the user for working with traces. SQL Server Profiler provides functionalities, such as displaying collected event data on its graphical interface, saving traces either in a file or in an SQL Server table, opening previously saved traces, extracting T-SQL statements from a trace,and many more. Finding and analyzing long running or costly queries, finding deadlocks and their related information, looking for which indexes are scanned, and looking for database connection requests are some of the practical applications of SQL Server Profiler.
To get list of all available event classes, you can query sys.trace_events catalog view.You can join sys.trace_events and sys.trace_categories
catalog views on category_id column to make correlation between the two views.
select e.trace_event_id, c.name from  sys.trace_events e
join sys.trace_categories c on e.category_id = c.category_id
Commonly-used event classes
The following list gives brief descriptions of commonly used event classes:
Commonly-used data columns
The following list gives brief descriptions of commonly used event classes:
Because two SQL Server logins named James and Peter with permissions on AdventureWorks2012 database are required, create them by performing the following steps:
1. Open SQL Server Management Studio.
2. Connect to the instance of SQL Server with login account having sysadmin rights.
3. Execute the following T-SQL script to create the logins and their corresponding users
in the AdventureWorks2012 database for James and Peter:
--Creating Login and User in
--AdventureWorks2012 database for James
USE [master]
GO
CREATE LOGIN [James] WITH PASSWORD=N‘JamesPass123‘
,DEFAULT_DATABASE=[AdventureWorks2012]
,CHECK_EXPIRATION=OFF
,CHECK_POLICY=OFF
GO
USE [AdventureWorks2012]
GO
CREATE USER [James] FOR LOGIN [James]
GO
ALTER ROLE [db_owner] ADD MEMBER [James]
GO
--Creating Login and User in AdventureWorks2012 database for Peter
USE [master]
GO
CREATE LOGIN [Peter] WITH PASSWORD=N‘PeterPass123‘
,DEFAULT_DATABASE=[AdventureWorks2012]
,CHECK_EXPIRATION=OFF
,CHECK_POLICY=OFF
GO
USE [AdventureWorks2012]
GO
CREATE USER [Peter] FOR LOGIN [Peter]
GO
ALTER ROLE [db_owner] ADD MEMBER [Peter]
GO
Now, we will create a trace and capture only events that occur for AdventureWorks2012 database from James‘ session only. To do this, follow these steps:
1. Start SQL Server Profiler.
2. Select New Trace… from the File menu. In the Connect to Server dialog box, provide connection details of SQL Server hosting the AdventureWorks2012 database and click on Connect.
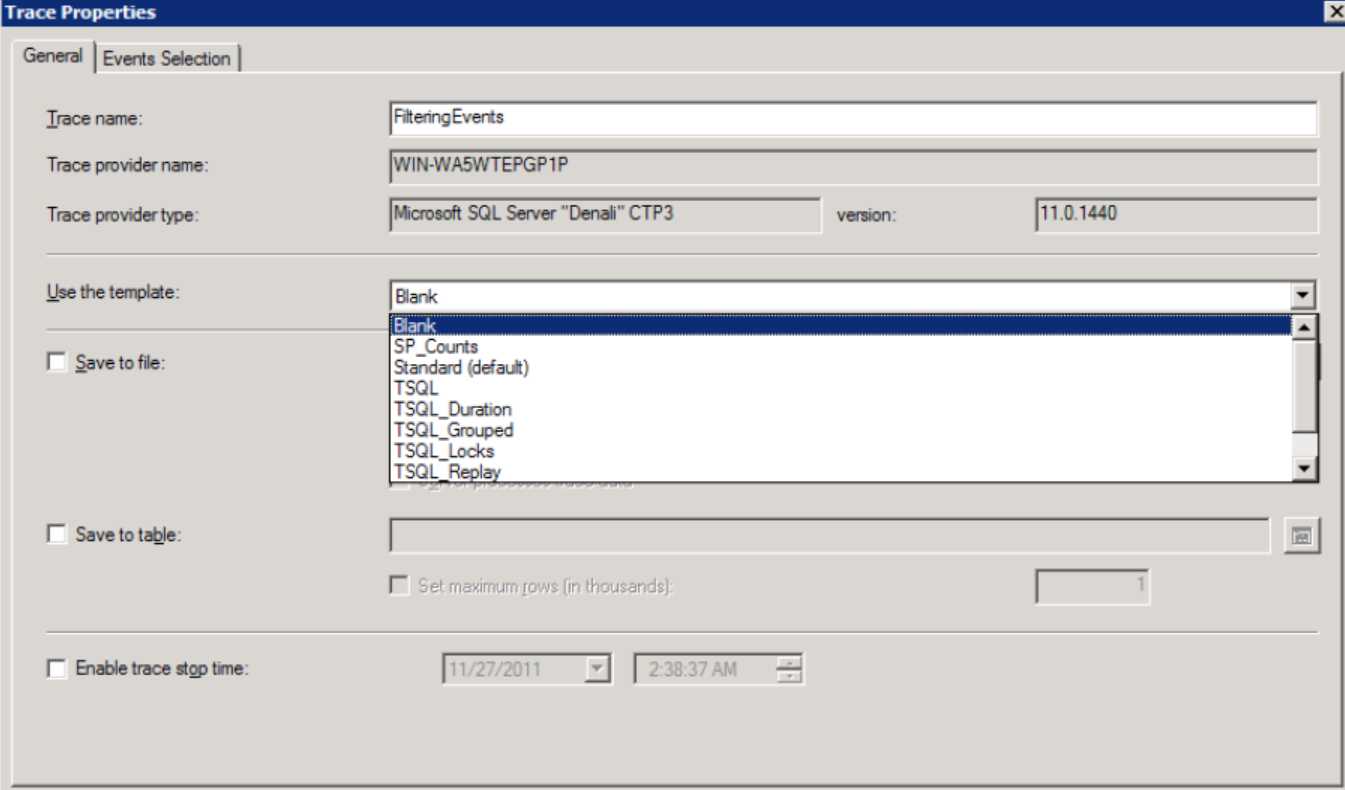
3. In the General tab of Trace Properties, enter FilteringEvents as the Trace name and select Blank template for the Use the template: drop-down menu as shown
in following:
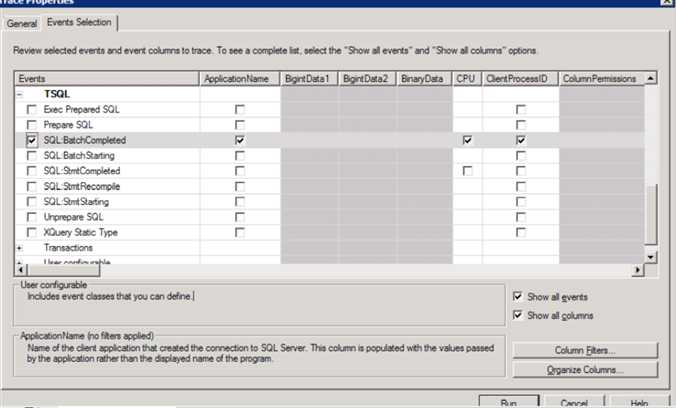
4. In Events Selection tab, check the checkbox for event class SQL:BatchCompleted under the TSQL event category as shown in following screenshot:
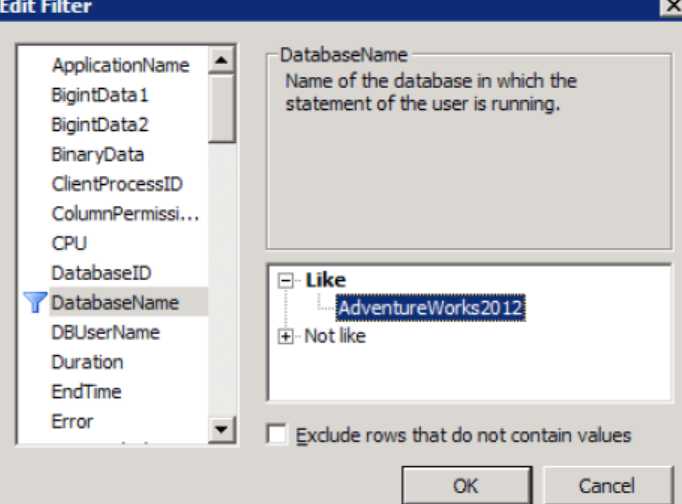
5. Click on Column Filters… button.
6. In the Edit Filter dialog box, select DatabaseName from the list of available data columns on the left. Expand the Like option and enter string value
AdventureWorks2012; then press the OK button as shown in the following screenshot:
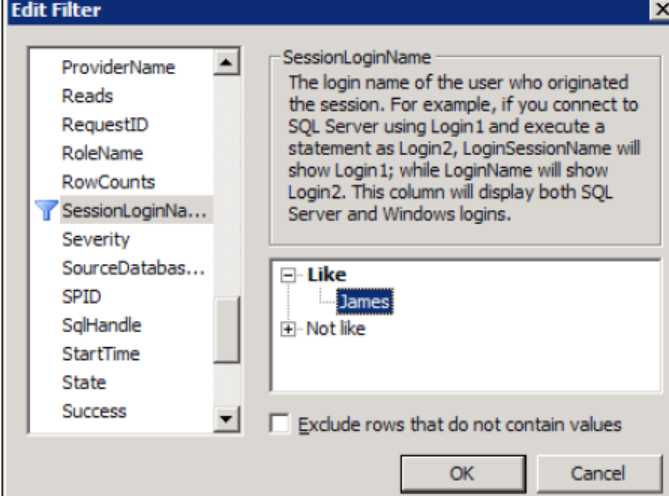
7. In the Edit Filter dialog box, select SessionLoginName from the list of available data columns on the left. Expand the Like option and enter string value James; then press the OK button as shown in following screenshot:
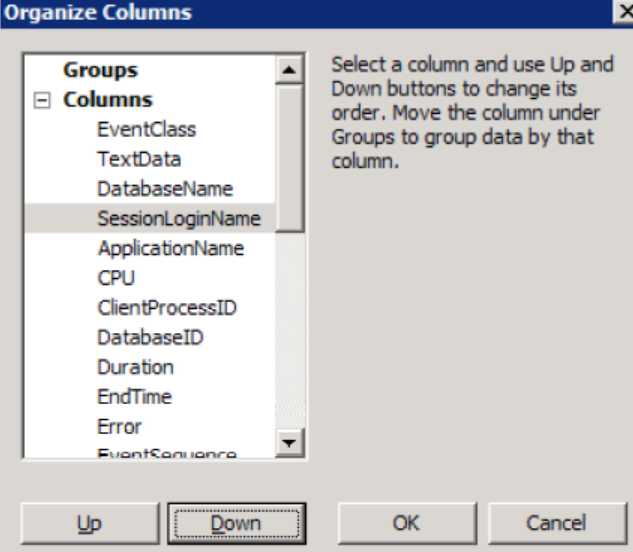
8. Click on the Organize Columns… button in Events Selection tab of Trace Properties dialog box. Select TextData data column and then keep clicking on Up button repeatedly to move the column up the order in the list, until the column appears as the second item, at the top of the list underneath EventClass data column. Do this same exercise also for the data columns DatabaseName and SessionLoginName so that the final order of the data columns should look like as shown in following screenshot. Press OK in the Organize Columns dialog box:
9. Click on the Run button to run the trace in the Trace Properties dialog box.
Now, we will open two instances of SQL Server Management Studio one by one that connect to SQL Server with the logins James and Peter respectively and run a few queries.
1. Open the first instance of SSMS and connect to SQL Server with the login credentials of James. In the query window, type and execute the T-SQL statements as shown in following script:
USE [AdventureWorks2012]
GO
SELECT * FROM [Sales].[Customer]
GO
USE [master]
GO
SELECT * FROM sys.databases
GO
2. Open a second instance of SSMS and connect to SQL Server with the login credentials of Peter. In the query window, type and execute the same T-SQL
queries as shown in previous step.
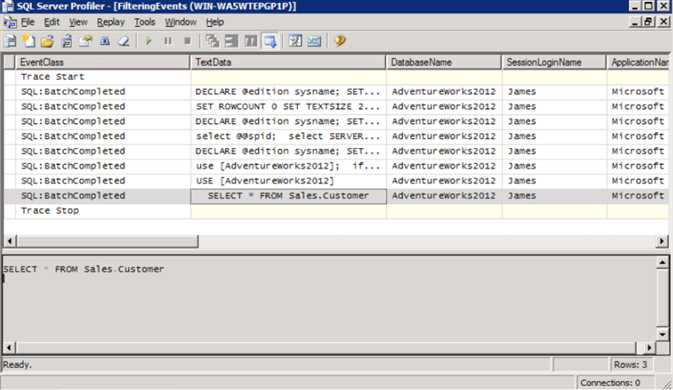
3. Switch to SQL Server Profiler window that is running the trace. Examine the trace data as shown in following screenshot:
Tips:Use of DatabaseID
We can alternatively use DatabaseID data column instead of DatabaseName to specify a filter on a particular database. For this, we must know system
assigned ID value for a specific database. This value can be retrieved by either calling DB_ID(‘AdventureWorks2012‘) metadata function or querying sys.databases catalog view.
Microsoft.SQL.Server2012.Performance.Tuning.Cookbook学习笔记(一)
标签:state compute spec peter nec cli dial spi other
原文地址:http://www.cnblogs.com/ld1977/p/7080065.html