标签:png param 阈值 size display use 网络服务 blog from
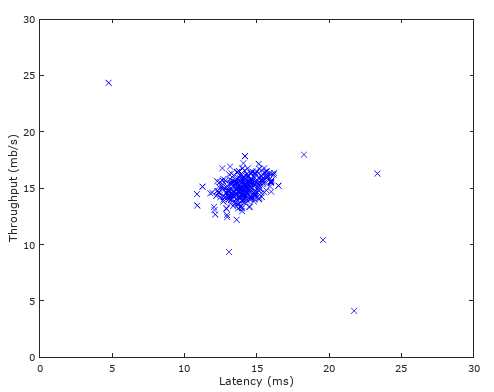
在基于高斯分布的异常检测算法一文中,详细给出了异常检测算法的原理及其公式,本文为该算法的Octave仿真。实例为,根据训练样例(一组网络服务器)的吞吐量(Throughput)和延迟时间(Latency)数据,标记出异常的服务器。
可视化的数据集如下:
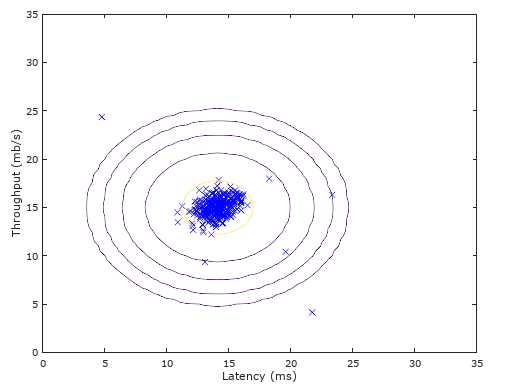
我们根据数据集X,计算其二维高斯分布的数学期望mu与方差sigma2:
function [mu sigma2] = estimateGaussian(X)
%ESTIMATEGAUSSIAN This function estimates the parameters of a
%Gaussian distribution using the data in X
%   [mu sigma2] = estimateGaussian(X),
%   The input X is the dataset with each n-dimensional data point in one row
%   The output is an n-dimensional vector mu, the mean of the data set
%   and the variances sigma^2, an n x 1 vector
%

% Useful variables
[m, n] = size(X);

mu = zeros(n, 1);
sigma2 = zeros(n, 1);


mu = sum(X,1)‘/m;
%note:mu and sigma are both n-demension.
for(i=1:m)
e=(X(i,:)‘-mu);
sigma2 += e.^2;
endfor

sigma2 = sigma2/m

end
计算概率密度:
function p = multivariateGaussian(X, mu, Sigma2)
%MULTIVARIATEGAUSSIAN Computes the probability density function of the
%multivariate gaussian distribution.
%    p = MULTIVARIATEGAUSSIAN(X, mu, Sigma2) Computes the probability
%    density function of the examples X under the multivariate gaussian
%    distribution with parameters mu and Sigma2. If Sigma2 is a matrix, it is
%    treated as the covariance matrix. If Sigma2 is a vector, it is treated
%    as the \sigma^2 values of the variances in each dimension (a diagonal
%    covariance matrix)
%

k = length(mu);

if (size(Sigma2, 2) == 1) || (size(Sigma2, 1) == 1)
    Sigma2 = diag(Sigma2);
end

X = bsxfun(@minus, X, mu(:)‘);
p = (2 * pi) ^ (- k / 2) * det(Sigma2) ^ (-0.5) * ...
    exp(-0.5 * sum(bsxfun(@times, X * pinv(Sigma2), X), 2));

end
可视化后:
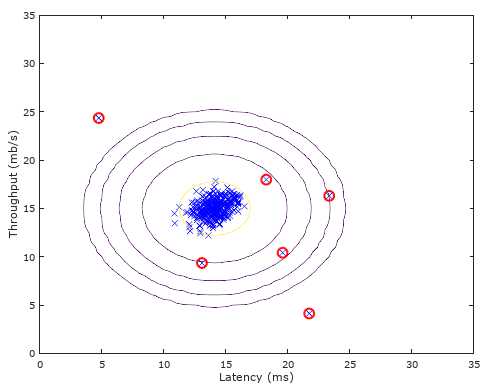
根据预留的一部分已知是否异常的训练样例(CV集),来选择阈值:
function [bestEpsilon bestF1] = selectThreshold(yval, pval)
%SELECTTHRESHOLD Find the best threshold (epsilon) to use for selecting
%outliers
%   [bestEpsilon bestF1] = SELECTTHRESHOLD(yval, pval) finds the best
%   threshold to use for selecting outliers based on the results from a
%   validation set (pval) and the ground truth (yval).
%

bestEpsilon = 0;
bestF1 = 0;
F1 = 0;

stepsize = (max(pval) - min(pval)) / 1000;
for epsilon = min(pval):stepsize:max(pval)


    pred = (pval<epsilon);

    p_e_1 = (pred==1);
    y_e_1 = (yval==1);
    p1 = 0;
    m = size(p_e_1,1);
    for(i=1:m)
      if((p_e_1(i)==1)&&(p_e_1(i)==y_e_1(i)))
        p1++;
      endif
    endfor
    p_12 = sum(pred);
    p_13 = sum(y_e_1);

    p=p1/p_12;
    r=p1/p_13;

    F1 = 2*p*r/(p+r);


    if F1 > bestF1
       bestF1 = F1;
       bestEpsilon = epsilon;
    end
end

end
最终的标记结果:
标签:png param 阈值 size display use 网络服务 blog from
原文地址:http://www.cnblogs.com/rhyswang/p/7089316.html