标签:img image http 显示 ase 取数据 png lower ict
#encoding:utf-8
import pandas as pd
import numpy as np
from sklearn import datasets,linear_model
from sklearn.metrics import roc_curve,auc
import pylab as pl
from matplotlib.pyplot import plot

def confusionMatrix(predicted,actual,threshold):
    if len(predicted)!=len(actual):return -1
    tp = 0.0
    fp = 0.0
    tn = 0.0
    fn = 0.0
    for i in range(len(actual)):
        if actual[i]>0.5:
            if predicted[i]>threshold:
                tp += 1.0
            else:
                fn += 1.0
        else:
            if predicted[i]<threshold:
                tn += 1.0
            else:
                fp += 1.0
    rtn = [fp,fn,fp,tn]
    return rtn
#获取数据
rockdata = open(‘sonar.all-data‘)
xList = []
labels = []
#将标签转换成数值,M转换成1.0,R转换为0.0
for line in rockdata:
    row = line.strip().split(",")
    if(row[-1] ==‘M‘):
        labels.append(1.0)
    else:
        labels.append(0.0)
    row.pop()
    floatRow = [float(num) for num in row]
    xList.append(floatRow)
print labels
#获取数据的行数,通过对3的求余,将数据划分为2个子集,1/3的测试集,2/3的训练集
indices = range(len(xList))
xListTest = [xList[i] for i in indices if i%3==0]
xListTrain = [xList[i] for i in indices if i%3!=0]
labelsTest = [labels[i] for i in indices if i%3==0]
labelsTrain = [labels[i] for i in indices if i%3!=0]
#将列表转换成数组
xTrain = np.array(xListTrain)
yTrain = np.array(labelsTrain)
xTest = np.array(xListTest)
yTest = np.array(labelsTest)
#预测模型
rocksVMinesModel = linear_model.LinearRegression()
#训练数据
rocksVMinesModel.fit(xTrain,yTrain)
# 预测训练数据
trainingPredictions = rocksVMinesModel.predict(xTrain)
print ("---------",trainingPredictions[0:5],trainingPredictions[-6:-1])
#生成训练数据的混淆矩阵
confusionMatTrain = confusionMatrix(trainingPredictions,yTrain,0.5)
print confusionMatTrain
#预测测试数据
testPredictions = rocksVMinesModel.predict(xTest)
#生成测试数据的混淆矩阵
confusionTest = confusionMatrix(testPredictions,yTest,0.5)
print confusionTest
#通过roc_curve函数计算fpt,tpr,并计算roc_auc,AUC越高代表越好
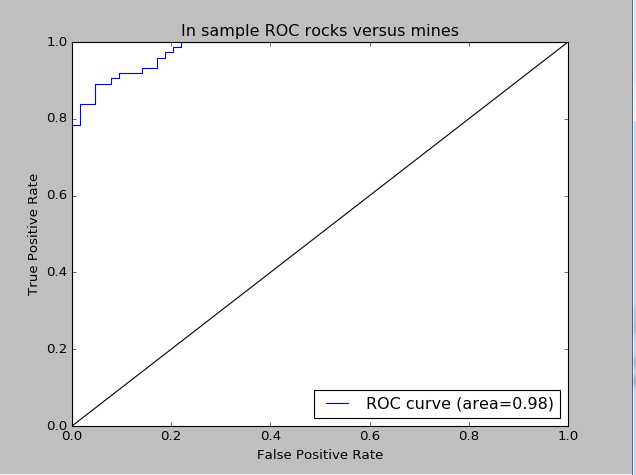
fpr,tpr,thresholds = roc_curve(yTrain,trainingPredictions)
roc_auc = auc(fpr,tpr)
print roc_auc
#生成训练集上的ROC曲线
#plot roc curve
pl.clf()#清楚图形,初始化图形的时候需要
pl.plot(fpr,tpr,label=‘ROC curve (area=%0.2f)‘ %roc_auc)#画ROC曲线
pl.plot([0,1],[0,1],‘k-‘)#生成对角线
pl.xlim([0.0,1.0])#X轴范围
pl.ylim([0.0,1.0])#Y轴范围
pl.xlabel(‘False Positive Rate‘)#X轴标签显示
pl.ylabel(‘True Positive Rate‘)#Y轴标签显示
pl.title(‘In sample ROC rocks versus mines‘)#标题
pl.legend(loc="lower left")#图例位置
pl.show()

#生成测试集上的ROC曲线
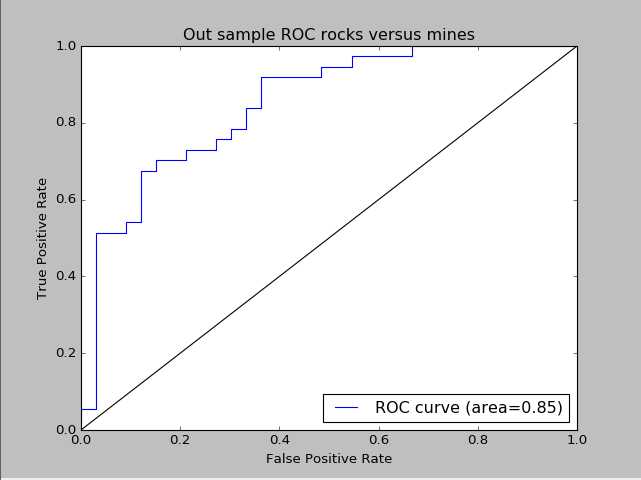
fpr,tpr,thresholds = roc_curve(yTest,testPredictions)
roc_auc = auc(fpr,tpr)
print roc_auc
#plot roc curve
pl.clf()
pl.plot(fpr,tpr,label=‘ROC curve (area=%0.2f)‘ %roc_auc)
pl.plot([0,1],[0,1],‘k-‘)
pl.xlim([0.0,1.0])
pl.ylim([0.0,1.0])
pl.xlabel(‘False Positive Rate‘)
pl.ylabel(‘True Positive Rate‘)
pl.title(‘In sample ROC rocks versus mines‘)
pl.legend(loc="lower right")
pl.show()


训练集上的ROC曲线

测试集上的ROC曲线

标签:img image http 显示 ase 取数据 png lower ict
原文地址:http://www.cnblogs.com/lxnz/p/7117426.html