D3 layouts help you create more advanced visualisations such as treemaps:
D3 layouts帮助您创造更加高级复杂的可视化图表,比如treemaps,packed circles,network graphs:
Layout is just a JavaScript function that takes your data as input and adds visual variables such as position and size to it.
一句话: layout就是一个接收你的data作为输入,而经过变换增加类似位置,大小等可视化变量到这个data上去的函数
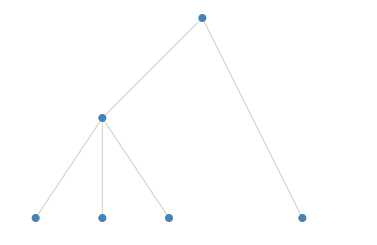
比如tree layout就接收一个层次化的结构数据,而对每个node增加x,y坐标,这样这些节点就形成一个类树的图形:
D3有很多中hierarchy layouts(处理层次化数据)和chord layout(处理网络信息流向)和一个通用的force layout(物理现象的模拟)。
注意:你也可以创建你自己的layout.比如你可以创建一个简单的函数,该函数仅仅给源data数组添加位置信息,这样的函数就可以被认为是一个layout
Hierarchical layouts
我们来看下面的层次化数据:
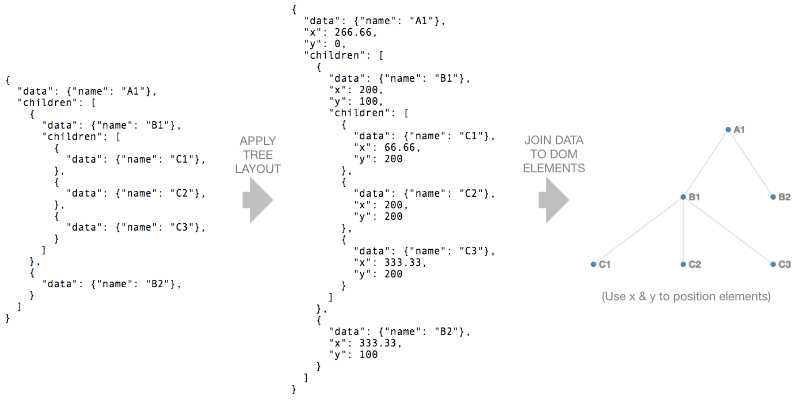
{"name":"A1","children":[{"name":"B1","children":[{"name":"C1","value":100},{"name":"C2","value":300},{"name":"C3","value":200}]},{"name":"B2","value":200}]}在这节里我们将来看看tree, cluster, treemap, pack和partition layout.注意:treemap, pack和partition被用于layout(转换)层次关系,这种层次关系图表中节点nodes有一个关联的数字值(比如:销售额,人口数量等).
D3 V4要求层次化输入数据规整后必须以d3.hierarchy对象的形式存在,这一点下面做详细介绍。
d3.hierarchy
一个d3.hierarchy object 是一种可以表达层次关系的数据结构。该object有一些实现获取比如:ancestor, descendant, leaf nodes信息(用于计算nodes之间的连接path)的预定义方法。对象本身可以通过d3.hierarchy(data)来生成。
var data = {
  "name": "A1",
  "children": [
    {
      "name": "B1",
      "children": [
        {
          "name": "C1",
          "value": 100
        },
        {
          "name": "C2",
          "value": 300
        },
        {
          "name": "C3",
          "value": 200
        }
      ]
    },
    {
      "name": "B2",
      "value": 200
    }
  ]
}

var root = d3.hierarchy(data)
一般情况下你不必直接对该hierarchy object操作,但是可以使用其定义的一些方法,比如:
root.descendants();
root.links()
root.descendants() 返回一个扁平的数组来表达root的子孙后代,而root.links()则返回一个扁平的对象数组来表达所有的父子links
More examples of hierarchy functions
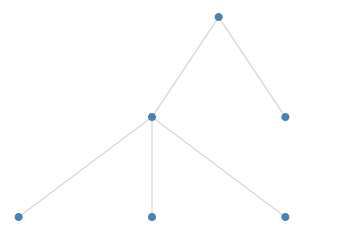
tree layout
tree layout将层级关系中的节点安排成一个tree like arrangement.
我们通过下面的代码首先来创建一个tree
var treeLayout = d3.tree();
我们使用.size()来配置tree的
treeLayout.size([400, 200]);
随后我们可以调用treeLayout函数,传入我们的hierarchy object root:
treeLayout(root);这个函数执行的结果是会将root的每一个node都增加上x和y的value
接着,我们可以:
- 使用
root.descendants()来得到所有节点的一个数组 - 将这个数组data join到circles(或者任何其他的svg element)
- 使用layout产生的x,y来给每个节点定位其坐标位置
并且。。。
- 使用
root.links()来获得所有links数组 - 将links数组join到line (or path) elements
- 使用link的source和target的x,y坐标值来画出每个line(也就是设置其d属性)
(注意root.links() 每一个数组元素都是一个包含了代表link的source和target的对象)
// Nodes
d3.select(‘svg g.nodes‘)
  .selectAll(‘circle.node‘)
  .data(root.descendants())
  .enter()
  .append(‘circle‘)
  .classed(‘node‘, true)
  .attr(‘cx‘, function(d) {return d.x;})
  .attr(‘cy‘, function(d) {return d.y;})
  .attr(‘r‘, 4);

// Links
d3.select(‘svg g.links‘)
  .selectAll(‘line.link‘)
  .data(root.links())
  .enter()
  .append(‘line‘)
  .classed(‘link‘, true)
  .attr(‘x1‘, function(d) {return d.source.x;})
  .attr(‘y1‘, function(d) {return d.source.y;})
  .attr(‘x2‘, function(d) {return d.target.x;})
  .attr(‘y2‘, function(d) {return d.target.y;});
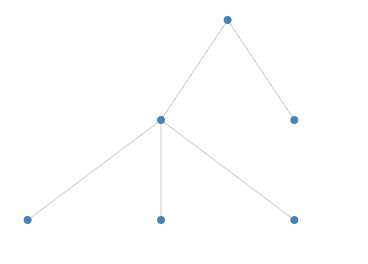
cluster layout
cluster layout 和 tree layout 是很相似的,主要的区别是所有的叶子节点都将放置在相同的深度
<svg width="400" height="220">
    <g transform="translate(5, 5)">
      <g class="links"></g>
      <g class="nodes"></g>
    </g>
  </svg>
var data = {
  "name": "A1",
  "children": [
    {
      "name": "B1",
      "children": [
        {
          "name": "C1",
          "value": 100
        },
        {
          "name": "C2",
          "value": 300
        },
        {
          "name": "C3",
          "value": 200
        }
      ]
    },
    {
      "name": "B2",
      "value": 200
    }
  ]
}

var clusterLayout = d3.cluster()
  .size([400, 200])

var root = d3.hierarchy(data)

clusterLayout(root)

// Nodes
d3.select(‘svg g.nodes‘)
  .selectAll(‘circle.node‘)
  .data(root.descendants())
  .enter()
  .append(‘circle‘)
  .classed(‘node‘, true)
  .attr(‘cx‘, function(d) {return d.x;})
  .attr(‘cy‘, function(d) {return d.y;})
  .attr(‘r‘, 4);

// Links
d3.select(‘svg g.links‘)
  .selectAll(‘line.link‘)
  .data(root.links())
  .enter()
  .append(‘line‘)
  .classed(‘link‘, true)
  .attr(‘x1‘, function(d) {return d.source.x;})
  .attr(‘y1‘, function(d) {return d.source.y;})
  .attr(‘x2‘, function(d) {return d.target.x;})
  .attr(‘y2‘, function(d) {return d.target.y;});
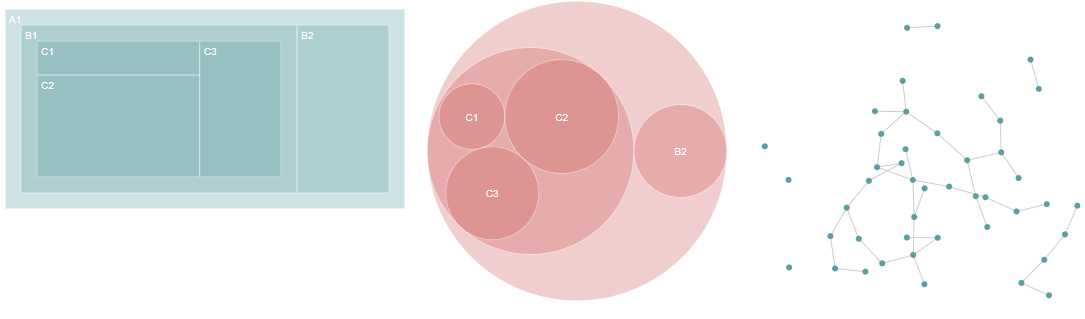
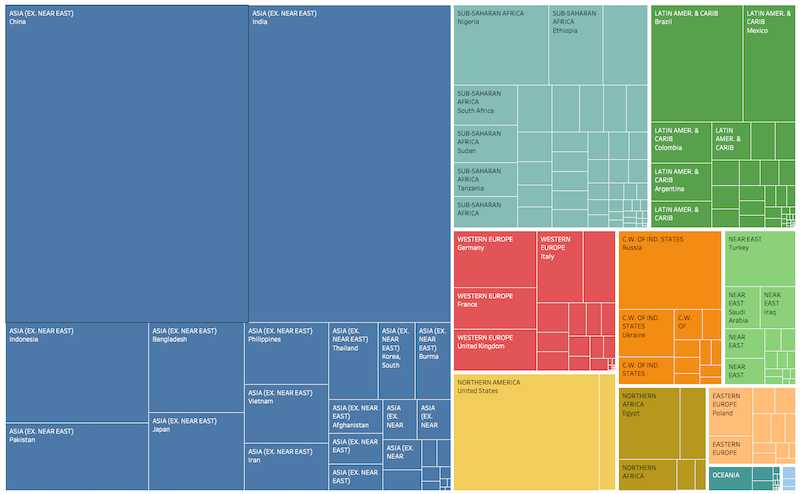
treemap layout
Treemaps用于可视化地代表层级关系,每个item都有一个相关的value
比如,我们可以将世界人口数据视作层次化的:第一级代表region,第二级代表各个country.一个treemap通过一个矩形代表一个国家(矩形的大小则和其人口数量大小成比例),而最终将每个region组合在一起:
var treemapLayout = d3.treemap();treemapLayout
.size([400, 200])
.paddingOuter(10);需要注意的是:在我们应用layout到我们的 hierarchy 之前,我们必须先运行 .sum() 在hierarchy上. 这个方法将遍历整颗树,并且在每个节点上设置.value以代表该节点下的所有子节点的数值之和
root.sum(function(d) {
  return d.value;
});
Note that we pass an accessor function into .sum() to specify which property to sum.
We can now call treemapLayout, passing in our hierarchy object:
treemapLayout(root);The layout adds 4 properties x0, x1, y0 and y1 to each node which specify the dimensions of each rectangle in the treemap.
Now we can join our nodes to rect elements and update the x, y, width and height properties of each rect:
d3.select(‘svg g‘)
  .selectAll(‘rect‘)
  .data(root.descendants())
  .enter()
  .append(‘rect‘)
  .attr(‘x‘, function(d) { return d.x0; })
  .attr(‘y‘, function(d) { return d.y0; })
  .attr(‘width‘, function(d) { return d.x1 - d.x0; })
.attr(‘height‘, function(d) { return d.y1 - d.y0; })If we’d like labels in each rectangle we could join g elements to the array and add rect and text elements to each g:
var nodes = d3.select(‘svg g‘)
  .selectAll(‘g‘)
  .data(rootNode.descendants())
  .enter()
  .append(‘g‘)
  .attr(‘transform‘, function(d) {return ‘translate(‘ + [d.x0, d.y0] + ‘)‘})

nodes
  .append(‘rect‘)
  .attr(‘width‘, function(d) { return d.x1 - d.x0; })
  .attr(‘height‘, function(d) { return d.y1 - d.y0; })

nodes
  .append(‘text‘)
  .attr(‘dx‘, 4)
  .attr(‘dy‘, 14)
  .text(function(d) {
    return d.data.name;
})treemap layouts can be configured in a number of ways:
- the padding around a node’s children can be set using
.paddingOuter - the padding between sibling nodes can be set using
.paddingInner - outer and inner padding can be set at the same time using
.padding - the outer padding can also be fine tuned using
.paddingTop,.paddingBottom,.paddingLeftand.paddingRight.
In the example above paddingTop is 20 and paddingInner is 2.
Treemaps can use different tiling strategies and D3 has several built in (treemapBinary, treemapDice, treemapSlice, treemapSliceDice, treemapSquarify) and the configuration function .tile is used to select one:
treemapLayout.tile(d3.treemapDice)treemapBinary strives for a balance between horizontal and vertical partitions, treemapDice partitions horizontally, treemapSlice partitions vertically, treemapSliceDice alternates between horizontal and vertical partioning and treemapSquarify allows the aspect ratio of the rectangles to be influenced.
The effect of different squarify ratios can be seen here.
pack layout
The pack layout is similar to the tree layout but circles instead of rectangles are used to represent nodes. In the example below each country is represented by a circle (sized according to population) and the countries are grouped by region.

D3’s pack layout is created using:
var packLayout = d3.pack();As usual we can configure its size:
packLayout.size([300, 300]);As with the treemap we must call .sum() on the hierarchy object root before applying the pack layout:
rootNode.sum(function(d) {
  return d.value;
});

packLayout(rootNode);
The pack layout adds x, y and r (for radius) properties to each node.
Now we can add circle elements for each descendant of root:
d3.select(‘svg g‘)
  .selectAll(‘circle‘)
  .data(rootNode.descendants())
  .enter()
  .append(‘circle‘)
  .attr(‘cx‘, function(d) { return d.x; })
  .attr(‘cy‘, function(d) { return d.y; })
.attr(‘r‘, function(d) { return d.r; })Labels can be added by creating g elements for each descendant:
var nodes = d3.select(‘svg g‘)
  .selectAll(‘g‘)
  .data(rootNode.descendants())
  .enter()
  .append(‘g‘)
  .attr(‘transform‘, function(d) {return ‘translate(‘ + [d.x, d.y] + ‘)‘})

nodes
  .append(‘circle‘)
  .attr(‘r‘, function(d) { return d.r; })

nodes
  .append(‘text‘)
  .attr(‘dy‘, 4)
  .text(function(d) {
    return d.children === undefined ? d.data.name : ‘‘;
})The padding around each circle can be configured using .padding():
packLayout.padding(10)partition layout
The partition layout subdivides a rectangular space into a layer for each layer of the hierarchy. Each layer is subdivided for each node in the layer:

D3’s partition layout is created using:
var partitionLayout = d3.partition();As usual we can configure its size:
partitionLayout.size([400, 200]);As with the treemap we must call .sum() on the hierarchy object root and before applying the partition layout:
rootNode.sum(function(d) {
  return d.value;
});

partitionLayout(rootNode);
The partition layout adds x0, x1, y0 and y1 properties to each node.
We can now add rect elements for each descendant of root:
d3.select(‘svg g‘)
  .selectAll(‘rect‘)
  .data(rootNode.descendants())
  .enter()
  .append(‘rect‘)
  .attr(‘x‘, function(d) { return d.x0; })
  .attr(‘y‘, function(d) { return d.y0; })
  .attr(‘width‘, function(d) { return d.x1 - d.x0; })
.attr(‘height‘, function(d) { return d.y1 - d.y0; });Padding can be added between nodes using .padding():
partitionLayout.padding(2)If we’d like to change the orientation of the partition layout so that the layers run left to right we can swap x0 with y0 and x1 with y1 when defining the rect elements:
  .attr(‘x‘, function(d) { return d.y0; })
  .attr(‘y‘, function(d) { return d.x0; })
  .attr(‘width‘, function(d) { return d.y1 - d.y0; })
.attr(‘height‘, function(d) { return d.x1 - d.x0; });We can also map the x dimension into a rotation angle and y into a radius to create a sunburst partition:
chord layout
Chord diagrams visualise links (or flows) between a group of nodes, where each flow has a numeric value. For example, they can show migration flows between countries. (Personally I find them difficult to interpret!)
The data needs to be in the form of an n x n matrix (where n is the number of items):
var data = [
  [10, 20, 30],
  [40, 60, 80],
  [100, 200, 300]
];
The first row represents flows from the 1st item to the 1st, 2nd and 3rd items etc.
We create the layout using:
var chordGenerator = d3.chord();and we configure it using .padAngle() (to set the angle between adjacent groups in radians), .sortGroups() (to specify the order of the groups), .sortSubgroups() (to sort within each group) and .sortChords() to determine the z order of the chords.
We apply the layout using:
var chords = chordGenerator(data);which returns an array of chords. Each element of the array is an object with source and target properties. Each source and target has startAngle and endAngle properties which will define the shape of each chord.
We use the ribbon shape generator which converts the chord properties into path data (see the Shapes chapter for more information on shape generators).
var ribbonGenerator = d3.ribbon().radius(200);

d3.select(‘g‘)
  .selectAll(‘path‘)
  .data(chords)
  .enter()
  .append(‘path‘)
  .attr(‘d‘, ribbonGenerator)