标签:orange 最小 creat ast mon line bar inpu 边框
barplot(H, xlab, ylab, main, names.arg, col)
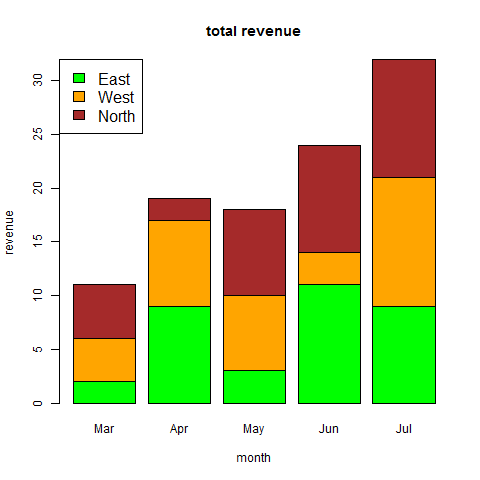
colors <- c("green","orange","brown")
months <- c("Mar","Apr","May","Jun","Jul")
regions <- c("East","West","North")
Values <- matrix(c(2,9,3,11,9,4,8,7,3,12,5,2,8,10,11),nrow = 3,ncol = 5,byrow = TRUE)
png(file = "barchart_stacked.png")
barplot(Values,main = "total revenue",names.arg = months,xlab = "month",ylab = "revenue",col = colors)
legend("topleft", regions, cex = 1.3, fill = colors)
dev.off()

boxplot(x, data, notch, varwidth, names, main)
png(file = "boxplot_with_notch.png")
boxplot(mpg ~ cyl, data = mtcars,
xlab = "Number of Cylinders",
ylab = "Miles Per Gallon",
main = "Mileage Data",
notch = TRUE,
varwidth = TRUE,
col = c("green","yellow","purple"),
names = c("High","Medium","Low")
)
dev.off()
hist(v,main,xlab,xlim,ylim,breaks,col,border)
plot(v,type,col,xlab,ylab)
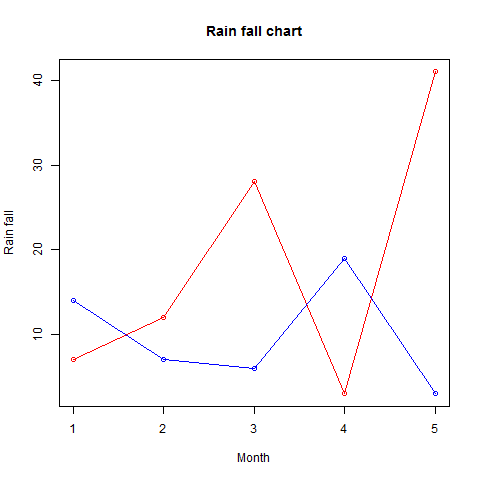
v <- c(7,12,28,3,41)
t <- c(14,7,6,19,3)
png(file = "line_chart_2_lines.jpg")
plot(v,type = "o",col = "red", xlab = "Month", ylab = "Rain fall", main = "Rain fall chart")
lines(t, type = "o", col = "blue")
dev.off()

plot(x, y, main, xlab, ylab, xlim, ylim, axes)
pairs(formula, data)
pie(x, labels, radius, main, col, clockwise)
标签:orange 最小 creat ast mon line bar inpu 边框
原文地址:http://www.cnblogs.com/freescience/p/7270667.html