标签:nbsp ram ges 语言 log images abi als 文件名

hist(x, breaks = "Sturges",
     freq = NULL, probability = !freq,
     include.lowest = TRUE, right = TRUE,
     density = NULL, angle = 45, col = NULL, border = NULL,
     main = paste("Histogram of" , xname),
     xlim = range(breaks), ylim = NULL,
     xlab = xname, ylab,
     axes = TRUE, plot = TRUE, labels = FALSE,
     nclass = NULL, warn.unused = TRUE, ...)
例如:
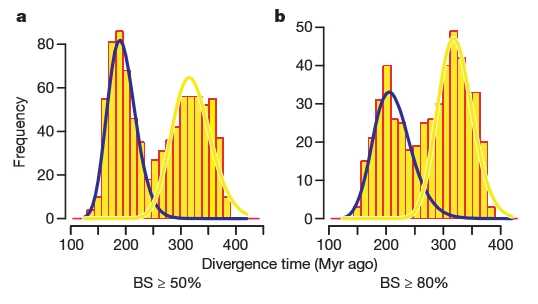
> hist(文件名$l列名,breaks=20,col = "颜色",border = "颜色",lty = 数字,lwd = 数字,xlim=c(100,450),main="标题",xlab="横坐标",ylab="纵坐标",xaxt="n")
    #xaxt=”n”为关闭x轴的坐标轴
    #lty,lwd线的类型与宽度
    #labels = TRUE,表示在每列头上标注数目,freq=FALSE 纵坐标可以显示概率,而不是数目
>axis= axis(1,at=seq(100,450,50))
    #添加上坐标轴:1代表横坐标轴,2代表中纵坐标,100,450代表坐标起始和终止位点,50代表间隔
标签:nbsp ram ges 语言 log images abi als 文件名
原文地址:http://www.cnblogs.com/shengxinjack/p/7273118.html