标签:bre connect local disco sts ice 定义 class framework
1. Hystrix Dashboard (断路器:hystrix 仪表盘)
Hystrix一个很重要的功能是,可以通过HystrixCommand收集相关数据指标. Hystrix Dashboard可以很高效的现实每个断路器的健康状况。
1). 在Ribbon服务g和Feign服务的Maven工程的pom.xml中都加入依赖
1 <dependency>
2     <groupId>org.springframework.boot</groupId>
3     <artifactId>spring-boot-starter-actuator</artifactId>
4  </dependency>
5 <dependency>
6     <groupId>org.springframework.cloud</groupId>
7     <artifactId>spring-cloud-starter-hystrix-dashboard</artifactId>
8 </dependency>
spring-boot-starter-actuator用于手机metric, 支持hystrix.stream。spring-cloud-starter-hystrix-dashboard支持dashboard的UI
2)在Spring Boot启动类上用@EnableHystrixDashboard注解和@EnableCircuitBreaker注解。需要特别注意的是我们之前的Feign服务由于内置断路器支持, 所以没有@EnableCircuitBreaker注解,但要使用Dashboard则必须加,如果不加,Dashboard无法接收到来自Feign内部断路器的监控数据,会报“Unable to connect to Command Metric Stream”错误
 1 @SpringBootApplication
 2 @EnableDiscoveryClient
 3 @EnableFeignClients
 4 @EnableCircuitBreaker
 5 @EnableHystrixDashboard
 6 public class ServiceFeignApplication {
 7
 8     public static void main(String[] args) {
 9         SpringApplication.run(ServiceFeignApplication.class, args);
10     }
11 }
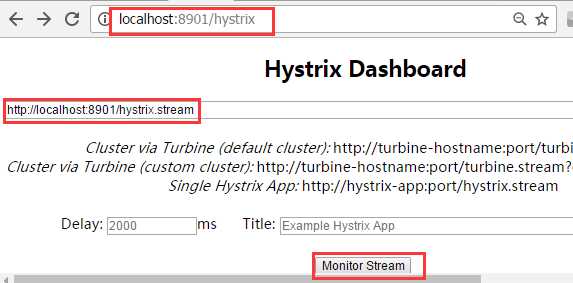
3)然后就可以访问/hystrix,这个URL将dashboard指向定义在Hystrix客户端应用中的/hystrix.stream
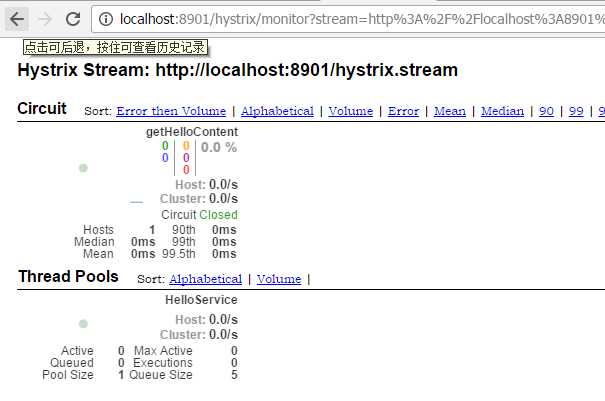
在dashboard中输入服务的URL:点击 monitor后进入监控界面,访问我们之前创建的Ribbon服务localhost:8901/, 或者Feign服务localhost:8902/可以看到监控UI动态变化
2. 利用Turbine工具在一个Dashboard上监控多个流
以上例子只能监控一个,要同时监控多个流怎么办?
下一篇:
参考: http://projects.spring.io/spring-cloud/spring-cloud.html#_circuit_breaker_hystrix_dashboard
Spring Cloud 入门教程(八): 断路器指标数据监控Hystrix Dashboard
标签:bre connect local disco sts ice 定义 class framework
原文地址:http://www.cnblogs.com/chry/p/7286601.html