标签:des style blog http color os io 使用 java
D3js技术文档
D3 allows you to bind arbitrary data to a Document Object Model (DOM), and then apply data-driven transformations to the document. For example, you can use D3 to generate an HTML table from an array of numbers. Or, use the same data to create an interactive SVG bar chart with smooth transitions and interaction.
D3 is not a monolithic framework that seeks to provide every conceivable feature. Instead, D3 solves the crux of the problem: efficient manipulation of documents based on data. This avoids proprietary representation and affords extraordinary flexibility, exposing the full capabilities of web standards such as CSS3, HTML5 and SVG. With minimal overhead, D3 is extremely fast, supporting large datasets and dynamic behaviors for interaction and animation. D3’s functional style allows code reuse through a diverse collection of components and plugins.
D3的全称是(Data-Driven Documents),顾名思义可以知道是一个关于数据驱动的文档的javascript类库。说得简单一点,D3.js主要是用于操作数据的,它通过使用HTML、SVG、CSS来给你的数据注入生命,即转换为各种简单易懂的绚丽的图形。
D3 是最流行的可视化库之一,它被很多其他的表格插件所使用。它允许绑定任意数据到DOM,然后将数据驱动转换应用到Document中。你可以使用它用一个数组创建基本的HMTL表格,或是利用它的流体过度和交互,用相似的数据创建惊人的SVG条形图。
环境:windows 7
安装方法: 在https://github.com/mbostock/d 下载d3压缩包,将其解压放入工程目录其内包含了d3的js库。比如本文使用ror环境开发,则将解压好的d3.js 文件放入C:\Users\Administrator\Desktop\portal-ec2\app\assets\javascripts目录下。
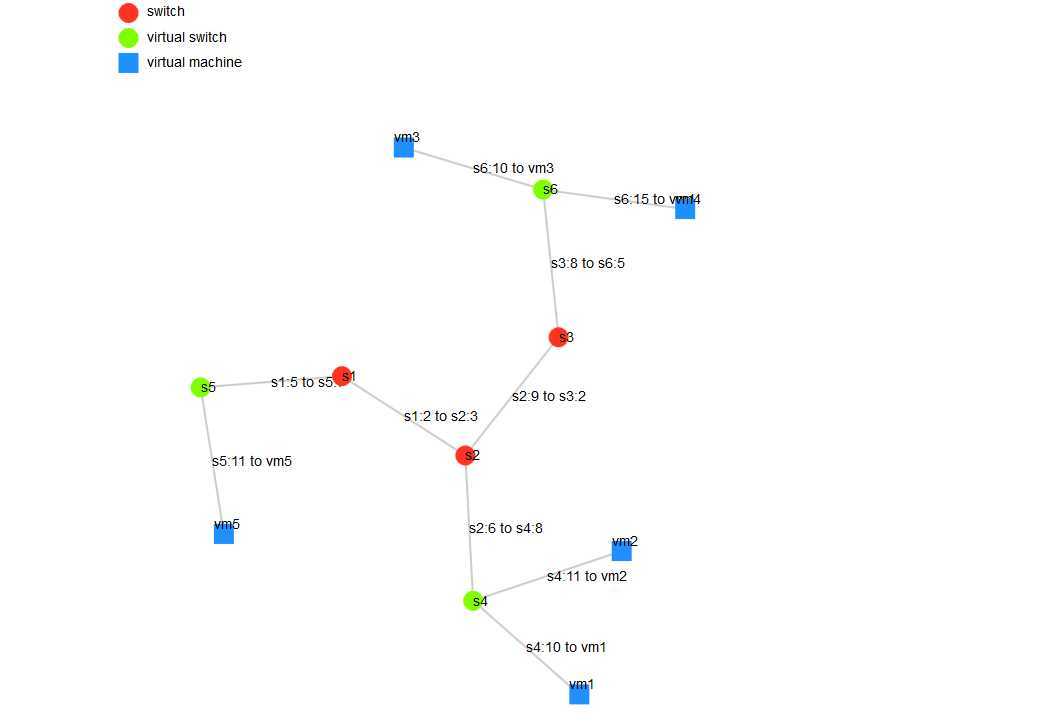
把工程内对应的交换机和虚拟机的拓扑结构用d3js表现出来。交换机和虚拟机的拓扑关系储存在工程内数据库(mysql)中,通过使用ruby语言将数据库中数据关系导出来后,使用d3js将其数据可视化。
数据库中有3张表来表示这个拓扑关系:
1、 switch_type:表示交换机是物理交换机还是虚拟交换机
2、 switch_to_switch:表示交换机之间的连接关系
3、 vm_to_switch:表示虚拟机和交换机之间的连接关系
在对应的controller中取出数据库数据,放入相应的实例变量
#存储拓扑
def topo
@vts = VmToSwitch.all
@sts = SwitchToSwitch.all
@stvs = SwitchToVswitch.all
End
在对应的views文件中储存所得到的实例变量中的数据
<% vts_size = @vts.size %>
<% sts_size = @sts.size %>
<% stvs_size = @stvs.size %>
<% all_size = vts_size + sts_size + stvs_size %>
<% v_and_s = Array.new(all_size ) %>
<% for i in 0..sts_size-1 do %>
<% v_and_s[i] = @sts[i] %>
<% end %>
<% for i in sts_size..sts_size+vts_size-1 do %>
<% v_and_s[i] = @vts[i-sts_size] %>
<% end %>
<% for i in sts_size+vts_size..all_size do %>
<% v_and_s[i] = @vts[i-sts_size-vts_size] %>
<% end %>
这样,所有的关系都已经储存在v_and_s数组中了。
生成拓扑关系中的点,放入nodes数组中
for(i = 0;i < idnum - vts_size; ++i) //把switch放入nodes
{
var node1 = {
"name": ids[i],
"type": "circle",
"switch_type": hashTable2[ids[i]]
};
nodes.push(node1);
}
for(i = idnum - vts_size;i < idnum; ++i) //把vm放入nodes
{
var node1 = {
"name": ids[i],
"type": "rect",
"switch_type": "rect" };
nodes.push(node1);
}
生成拓扑关系中的边,放入edges数组中
for(i = 0 ; i < all_size; ++i)
{
var ss = hashTable[all_array[i][0]];
var tt = hashTable[all_array[i][2]]
var desc = all_array[i][1];
var edges1 = {
"source": ss,
"target": tt,
"des": desc
};
edges.push(edges1);
}
这样就能生成如下所示的数据对象数组,这样是为了对应d3js中相应的函数
nodes: [
{ name: "s1" , type:”cicle”,switch_type:”1”},
{ name: "s2" ,type:”cicle”,switch_type:”1”},
{ name: "s3" ,type:”rect”,switch_type:”2”}
]
edges: [
{ source: 0, target: 1 ,des:"s1"},
{ source: 0, target: 2 ,des:"s2"},
{ source: 1, target: 2 ,des:"s3"}
]
以下工作都是在js脚本中进行,把此js脚本嵌入html页面即可实现可视化功能
在body元素最后添加svg图形
var svg = d3.select("body").append("svg")
.attr("width", w)
.attr("height", h);
利用d3js函数库生成力导向模型(拓扑关系图)
var force = d3.layout.force()
.nodes(nodes)
.links(edges)
.size([w, h])
.linkDistance([150])
.charge([-3000]);
force.start(); //启动模型
生成图形中的边
var edges = svg.selectAll("line")
.data(dataset.edges)
.enter()
.append("line")
.style("stroke", stroke_color)
.style("stroke-width", stroke_width)
.call(force.drag);
生成图形中的点
var node = svg.selectAll("node");
node = node.data(dataset.nodes);
var nodeEnter = node.enter().append("g")
.attr("class", "node")
.call(force.drag);
nodeEnter.append("circle")
.attr("r", 10)
.style("fill", function(d, i) {
return color(i); })
最后,打开对应的html页面,即可看到类似的拓扑关系图
在学习d3的过程中,需要了解相应的js语言的知识,其中对应匿名函数的应用非常多,可以进行相应的学习。
在画拓扑关系中遇到一个很痛苦的事情是把矩形和圆表现在一个svg图形中并且使他们满足对应的关系,这样用函数不能进行图形的选择,我做的方法是在一个点中同时添加一个矩形和一个圆,然后可以根据点的属性type来使圆显示或者使矩形显示,这样就做出了将圆和矩形连接在一起的效果!
官方文档:http://d3js.org/
官方力导向模型学习文档:https://github.com/mbostock/d3/wiki/Force-Layout
官方资源:https://github.com/mbostock/d3
标签:des style blog http color os io 使用 java
原文地址:http://www.cnblogs.com/juandx/p/3959900.html