码迷,mamicode.com
首页 > 编程语言 > 详细

python 数据分析----matplotlib

时间:2017-10-30 18:27:58      阅读:228      评论:0      收藏:0      [点我收藏+]

标签:画布   top   bottom   out   images   src   tle   width   adjust   

Matplotlib是一个强大的Python绘图和数据可视化的工具包。

安装方法:pip install matplotlib

引用方法:import matplotlib.pyplot as plt

绘图函数:plt.plot()

显示图像:plt.show()

简单示例:

In [268]: import matplotlib.pyplot as plt

In [269]: x = np.linspace(5,15,1000)

In [270]: y = x*x

In [271]: plt.plot(x,y)
Out[271]: [<matplotlib.lines.Line2D at 0x10bdbd198>]

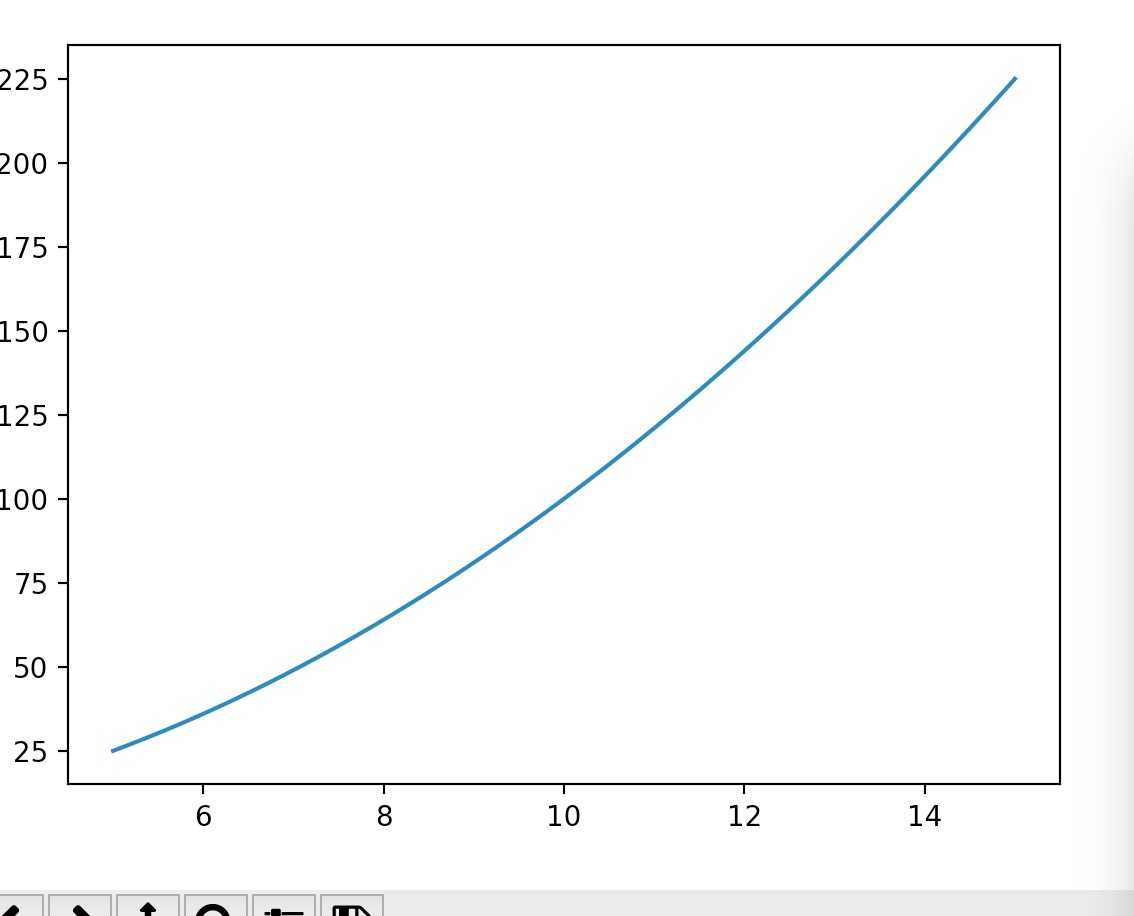
In [272]: plt.show()

图像如图:
技术分享

plot函数:

  • 线型linestyle(-,-.,--,..)
  • 点型marker(v,^,s,*,H,+,x,D,o,…)
  • 颜色color(b,g,r,y,k,w,…)
  • plot函数绘制多条曲线
  • 标题:set_title
  • x轴:set_xlabel
  • y轴:y_label
  • 其他类型图像:
    • hist 频数直方图

画布与图:

画布:figure

  • fig = plt.figure()

图:subplot

  • ax1 = fig.add_subplot(2,2,1) #2行2列放第一个位置

调节子图间距:

  • subplots_adjust(left, bottom, right, top, wspace, hspace)

python 数据分析----matplotlib

标签:画布   top   bottom   out   images   src   tle   width   adjust   

原文地址:http://www.cnblogs.com/mona524/p/7755437.html

(0)
(0)
   
举报
评论 一句话评论(0
登录后才能评论!
© 2014 mamicode.com 版权所有  联系我们:gaon5@hotmail.com
迷上了代码!