标签:最简 com src figure and dom log rand oba
import numpy as np
import matplotlib.pyplot as plt
X=np.array([[1,3,3],
           [1,4,3],
            [1,1,1]])
Y=np.array([1,1,-1])
W=(np.random.random(3)-0.5)*2
print(W)
lr=0.11
n=0
O=0
def update():
    global X,Y,W,lr,n
    n+=1
    O=np.sign(np.dot(X,W.T))
    W_C=lr*((Y-O.T).dot(X))/int(X.shape[0])
    W=W+W_C
for _ in range(100):
    update()
    print(W)
    print(n)
    O=np.sign(np.dot(X,W.T))
    if(O==Y.T).all():
        print("完成")
        break
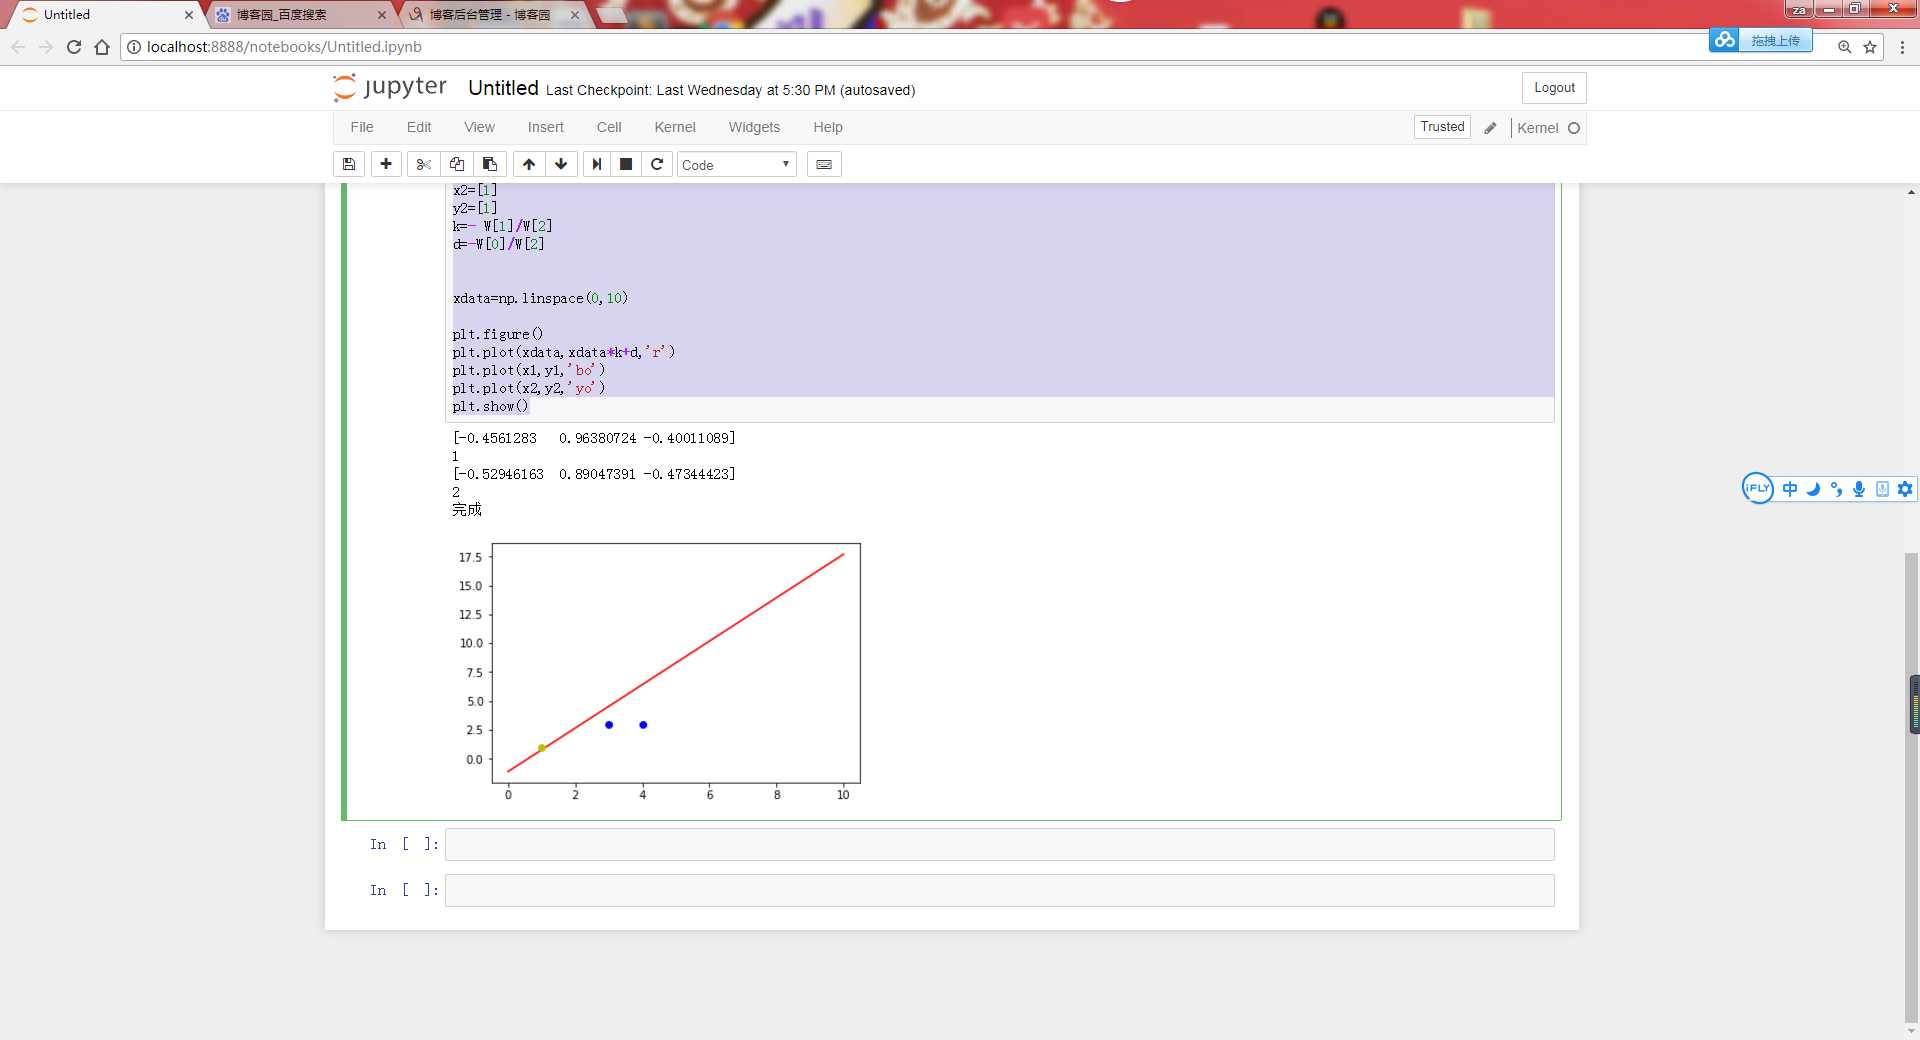
x1=[3,4]
y1=[3,3]
x2=[1]
y2=[1]
k=- W[1]/W[2]
d=-W[0]/W[2]


xdata=np.linspace(0,10)

plt.figure()
plt.plot(xdata,xdata*k+d,‘r‘)
plt.plot(x1,y1,‘bo‘)
plt.plot(x2,y2,‘yo‘)
plt.show()

标签:最简 com src figure and dom log rand oba
原文地址:http://www.cnblogs.com/wwwhza/p/7780175.html