AHRS(attitude and heading reference system)称为航姿参考系统。
首先,我们明确一下四元数的知识。
四元数(quaternion)是由我们的威廉·哈密顿提出的。哈密顿就是那个‘哈密顿最小作用原理’的提出者。
四元数可视为复数的扩展。在复数中,定义了,而四元数中则定义了
。也就是说四元数是一个具有三个虚部的虚数。把这些虚部理解为一个复数空间的话,四元数就是一个四位空间。这个是纯数学问题,有兴趣可以了解群论,本人也不是很理解所以也不多讲啦。
但是四元数本身最多的就是使用单位四元数来表示三维空间的旋转(rotation)及定向(orientation)。
为了方便,我们下面使用q = ((x, y, z),w) = (v, w),其中v是向量,w是实数,这样的式子来表示一个四元数。下述内容采自知乎。
首先,定义一个你需要做的旋转。旋转轴为向量,旋转角度为
(右手法则的旋转)。如下图所示:
此图中,
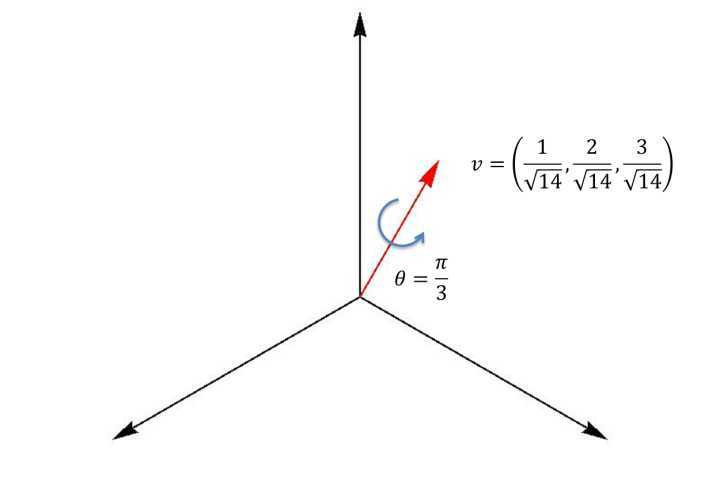
那么与此相对应的四元数(下三行式子都是一个意思,只是不同的表达形式)
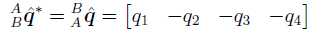
这时它的共轭(下三行式子都是一个意思,只是不同的表达形式),
如果你想算一个点在这个旋转下新的坐标
,需要进行如下操作,
1.定义纯四元数
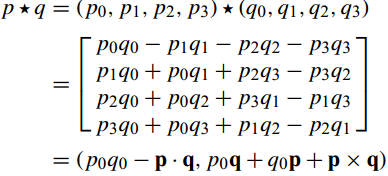
2.进行四元数运算
3.产生的一定是纯四元数,也就是说它的第一项为0,有如下形式:
4.中的后三项
就是
:
这样,就完成了一次四元数旋转运算。
同理,如果你有一个四元数:
那么,它对应一个以向量为轴旋转
角度的旋转操作(右手法则的旋转)。
 是描述了B相对于A的旋转,其中的rx,ry,rz组成的向量也是处于A中的向量。
 。我们有:
。我们有:
- 封闭性:易证明,p和p的共轭相乘即可,|p*q|=1。
- 结合律:这条也很好证明,只要证明(p*q)*r=p*(q*r)。
更多资料可以参考:https://zhuanlan.zhihu.com/p/28189289
我们下一步来看一下通过陀螺仪输出的角加速度估计姿态问题。
数学操作部分:
如果那些角速度被分配到向量 的时候,即
的时候,即
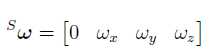
的时候。
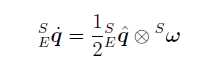
表示传感器所在坐标相对于地磁坐标的姿态改变速率的四元数微分可以表示为下边公式:
 为从E坐标到S坐标的预测值。
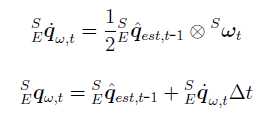
而在时间t,地球坐标系相对于传感器坐标系的四元数 可以同过
可以同过 的积分获得。而是通过预测值
 与时间t时刻形成的角速度
 的叉乘获得的。
在不在对q进行二次处理的话,姿态预测值就是现在的姿态值。
下面就是一个求解传感器所在坐标系的姿态。
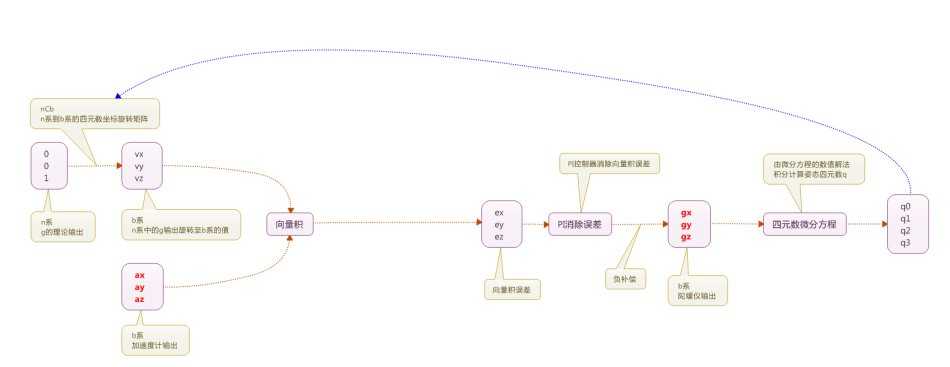
开始,基于一个初始为[1 0 0 0]的四元数得到 q = [1 0 0 0], 根据加速度求得加速度的单位向量,根据q求转换到b系的值v。
而 v = [2*(q(2)*q(4)-q(1)*q(3)) 2*(q(1)*q(2)+q(3)*q(4)) q(1)^2 -q(2)^2 -q(3)^2+q(4)^2]
而后计算误差,其中加速度与计算得到的v的向量积可以得到误差值。
计算得到的积分误差为误差的积分,即误差和加上误差乘以采样时间。
classdef MahonyAHRS < handle
%MAYHONYAHRS Madgwick‘s implementation of Mayhony‘s AHRS algorithm
%
%   For more information see:
%   http://www.x-io.co.uk/node/8#open_source_ahrs_and_imu_algorithms
%
%   Date          Author          Notes
%   28/09/2011    SOH Madgwick    Initial release

    %% Public properties
    properties (Access = public)
        SamplePeriod = 1/256;
        Quaternion = [1 0 0 0];     % output quaternion describing the Earth relative to the sensor
        Kp = 1;                     % algorithm proportional gain
        Ki = 0;                     % algorithm integral gain
    end

    %% Public properties
    properties (Access = private)
        eInt = [0 0 0];             % integral error
    end

    %% Public methods
    methods (Access = public)
        function obj = MahonyAHRS(varargin)
            for i = 1:2:nargin
                if  strcmp(varargin{i}, ‘SamplePeriod‘), obj.SamplePeriod = varargin{i+1};
                elseif  strcmp(varargin{i}, ‘Quaternion‘), obj.Quaternion = varargin{i+1};
                elseif  strcmp(varargin{i}, ‘Kp‘), obj.Kp = varargin{i+1};
                elseif  strcmp(varargin{i}, ‘Ki‘), obj.Ki = varargin{i+1};
                else error(‘Invalid argument‘);
                end
            end;
        end
        function obj = Update(obj, Gyroscope, Accelerometer, Magnetometer)
            q = obj.Quaternion; % short name local variable for readability

            % Normalise accelerometer measurement
            if(norm(Accelerometer) == 0), return; end   % handle NaN
            Accelerometer = Accelerometer / norm(Accelerometer);    % normalise magnitude

            % Normalise magnetometer measurement
            if(norm(Magnetometer) == 0), return; end    % handle NaN
            Magnetometer = Magnetometer / norm(Magnetometer);   % normalise magnitude

            % Reference direction of Earth‘s magnetic feild
            h = quaternProd(q, quaternProd([0 Magnetometer], quaternConj(q)));
            b = [0 norm([h(2) h(3)]) 0 h(4)];

            % Estimated direction of gravity and magnetic field
            v = [2*(q(2)*q(4) - q(1)*q(3))
                 2*(q(1)*q(2) + q(3)*q(4))
                 q(1)^2 - q(2)^2 - q(3)^2 + q(4)^2];
            w = [2*b(2)*(0.5 - q(3)^2 - q(4)^2) + 2*b(4)*(q(2)*q(4) - q(1)*q(3))
                 2*b(2)*(q(2)*q(3) - q(1)*q(4)) + 2*b(4)*(q(1)*q(2) + q(3)*q(4))
                 2*b(2)*(q(1)*q(3) + q(2)*q(4)) + 2*b(4)*(0.5 - q(2)^2 - q(3)^2)];

            % Error is sum of cross product between estimated direction and measured direction of fields
            e = cross(Accelerometer, v) + cross(Magnetometer, w);
            if(obj.Ki > 0)
                obj.eInt = obj.eInt + e * obj.SamplePeriod;
            else
                obj.eInt = [0 0 0];
            end

            % Apply feedback terms
            Gyroscope = Gyroscope + obj.Kp * e + obj.Ki * obj.eInt;

            % Compute rate of change of quaternion
            qDot = 0.5 * quaternProd(q, [0 Gyroscope(1) Gyroscope(2) Gyroscope(3)]);

            % Integrate to yield quaternion
            q = q + qDot * obj.SamplePeriod;
            obj.Quaternion = q / norm(q); % normalise quaternion
        end
        function obj = UpdateIMU(obj, Gyroscope, Accelerometer)
            q = obj.Quaternion; % short name local variable for readability

            % Normalise accelerometer measurement
            if(norm(Accelerometer) == 0), return; end   % handle NaN
            Accelerometer = Accelerometer / norm(Accelerometer);	% normalise magnitude

            % Estimated direction of gravity and magnetic flux
            v = [2*(q(2)*q(4) - q(1)*q(3))
                 2*(q(1)*q(2) + q(3)*q(4))
                 q(1)^2 - q(2)^2 - q(3)^2 + q(4)^2];

            % Error is sum of cross product between estimated direction and measured direction of field
            e = cross(Accelerometer, v);
            if(obj.Ki > 0)
                obj.eInt = obj.eInt + e * obj.SamplePeriod;
            else
                obj.eInt = [0 0 0];
            end

            % Apply feedback termszai
            Gyroscope = Gyroscope + obj.Kp * e + obj.Ki * obj.eInt;

            % Compute rate of change of quaternion
            qDot = 0.5 * quaternProd(q, [0 Gyroscope(1) Gyroscope(2) Gyroscope(3)]);

            % Integrate to yield quaternion
            q = q + qDot * obj.SamplePeriod;
            obj.Quaternion = q / norm(q); % normalise quaternion
        end
    end
end
%% Housekeeping

addpath(‘ximu_matlab_library‘);	% include x-IMU MATLAB library
addpath(‘quaternion_library‘);	% include quatenrion library
close all;                     	% close all figures
clear;                         	% clear all variables
clc;                          	% clear the command terminal

%% Import data

xIMUdata = xIMUdataClass(‘LoggedData/LoggedData‘);

samplePeriod = 1/256;

gyr = [xIMUdata.CalInertialAndMagneticData.Gyroscope.X...
       xIMUdata.CalInertialAndMagneticData.Gyroscope.Y...
       xIMUdata.CalInertialAndMagneticData.Gyroscope.Z];        % gyroscope
acc = [xIMUdata.CalInertialAndMagneticData.Accelerometer.X...
       xIMUdata.CalInertialAndMagneticData.Accelerometer.Y...
       xIMUdata.CalInertialAndMagneticData.Accelerometer.Z];	% accelerometer

% Plot
figure(‘NumberTitle‘, ‘off‘, ‘Name‘, ‘Gyroscope‘);
hold on;
plot(gyr(:,1), ‘r‘);
plot(gyr(:,2), ‘g‘);
plot(gyr(:,3), ‘b‘);
xlabel(‘sample‘);
ylabel(‘dps‘);
title(‘Gyroscope‘);
legend(‘X‘, ‘Y‘, ‘Z‘);

figure(‘NumberTitle‘, ‘off‘, ‘Name‘, ‘Accelerometer‘);
hold on;
plot(acc(:,1), ‘r‘);
plot(acc(:,2), ‘g‘);
plot(acc(:,3), ‘b‘);
xlabel(‘sample‘);
ylabel(‘g‘);
title(‘Accelerometer‘);
legend(‘X‘, ‘Y‘, ‘Z‘);

%% Process data through AHRS algorithm (calcualte orientation)
% See: http://www.x-io.co.uk/open-source-imu-and-ahrs-algorithms/

R = zeros(3,3,length(gyr));     % rotation matrix describing sensor relative to Earth

ahrs = MahonyAHRS(‘SamplePeriod‘, samplePeriod, ‘Kp‘, 1);

for i = 1:length(gyr)
    ahrs.UpdateIMU(gyr(i,:) * (pi/180), acc(i,:));	% gyroscope units must be radians
    R(:,:,i) = quatern2rotMat(ahrs.Quaternion)‘;    % transpose because ahrs provides Earth relative to sensor
end

%% Calculate ‘tilt-compensated‘ accelerometer

tcAcc = zeros(size(acc));  % accelerometer in Earth frame

for i = 1:length(acc)
    tcAcc(i,:) = R(:,:,i) * acc(i,:)‘;
end

% Plot
figure(‘NumberTitle‘, ‘off‘, ‘Name‘, ‘‘‘Tilt-Compensated‘‘ accelerometer‘);
hold on;
plot(tcAcc(:,1), ‘r‘);
plot(tcAcc(:,2), ‘g‘);
plot(tcAcc(:,3), ‘b‘);
xlabel(‘sample‘);
ylabel(‘g‘);
title(‘‘‘Tilt-compensated‘‘ accelerometer‘);
legend(‘X‘, ‘Y‘, ‘Z‘);

%% Calculate linear acceleration in Earth frame (subtracting gravity)

linAcc = tcAcc - [zeros(length(tcAcc), 1), zeros(length(tcAcc), 1), ones(length(tcAcc), 1)];
linAcc = linAcc * 9.81;     % convert from ‘g‘ to m/s/s

% Plot
figure(‘NumberTitle‘, ‘off‘, ‘Name‘, ‘Linear Acceleration‘);
hold on;
plot(linAcc(:,1), ‘r‘);
plot(linAcc(:,2), ‘g‘);
plot(linAcc(:,3), ‘b‘);
xlabel(‘sample‘);
ylabel(‘g‘);
title(‘Linear acceleration‘);
legend(‘X‘, ‘Y‘, ‘Z‘);

%% Calculate linear velocity (integrate acceleartion)

linVel = zeros(size(linAcc));

for i = 2:length(linAcc)
    linVel(i,:) = linVel(i-1,:) + linAcc(i,:) * samplePeriod;
end

% Plot
figure(‘NumberTitle‘, ‘off‘, ‘Name‘, ‘Linear Velocity‘);
hold on;
plot(linVel(:,1), ‘r‘);
plot(linVel(:,2), ‘g‘);
plot(linVel(:,3), ‘b‘);
xlabel(‘sample‘);
ylabel(‘g‘);
title(‘Linear velocity‘);
legend(‘X‘, ‘Y‘, ‘Z‘);

%% High-pass filter linear velocity to remove drift

order = 1;
filtCutOff = 0.1;
[b, a] = butter(order, (2*filtCutOff)/(1/samplePeriod), ‘high‘);
linVelHP = filtfilt(b, a, linVel);

% Plot
figure(‘NumberTitle‘, ‘off‘, ‘Name‘, ‘High-pass filtered Linear Velocity‘);
hold on;
plot(linVelHP(:,1), ‘r‘);
plot(linVelHP(:,2), ‘g‘);
plot(linVelHP(:,3), ‘b‘);
xlabel(‘sample‘);
ylabel(‘g‘);
title(‘High-pass filtered linear velocity‘);
legend(‘X‘, ‘Y‘, ‘Z‘);

%% Calculate linear position (integrate velocity)

linPos = zeros(size(linVelHP));

for i = 2:length(linVelHP)
    linPos(i,:) = linPos(i-1,:) + linVelHP(i,:) * samplePeriod;
end

% Plot
figure(‘NumberTitle‘, ‘off‘, ‘Name‘, ‘Linear Position‘);
hold on;
plot(linPos(:,1), ‘r‘);
plot(linPos(:,2), ‘g‘);
plot(linPos(:,3), ‘b‘);
xlabel(‘sample‘);
ylabel(‘g‘);
title(‘Linear position‘);
legend(‘X‘, ‘Y‘, ‘Z‘);

%% High-pass filter linear position to remove drift

order = 1;
filtCutOff = 0.1;
[b, a] = butter(order, (2*filtCutOff)/(1/samplePeriod), ‘high‘);
linPosHP = filtfilt(b, a, linPos);

% Plot
figure(‘NumberTitle‘, ‘off‘, ‘Name‘, ‘High-pass filtered Linear Position‘);
hold on;
plot(linPosHP(:,1), ‘r‘);
plot(linPosHP(:,2), ‘g‘);
plot(linPosHP(:,3), ‘b‘);
xlabel(‘sample‘);
ylabel(‘g‘);
title(‘High-pass filtered linear position‘);
legend(‘X‘, ‘Y‘, ‘Z‘);

%% Play animation

SamplePlotFreq = 8;

SixDOFanimation(linPosHP, R, ...
                ‘SamplePlotFreq‘, SamplePlotFreq, ‘Trail‘, ‘Off‘, ...
                ‘Position‘, [9 39 1280 720], ...
                ‘AxisLength‘, 0.1, ‘ShowArrowHead‘, false, ...
                ‘Xlabel‘, ‘X (m)‘, ‘Ylabel‘, ‘Y (m)‘, ‘Zlabel‘, ‘Z (m)‘, ‘ShowLegend‘, false, ‘Title‘, ‘Unfiltered‘,...
                ‘CreateAVI‘, false, ‘AVIfileNameEnum‘, false, ‘AVIfps‘, ((1/samplePeriod) / SamplePlotFreq));

%% End of script
function fig = SixDOFanimation(varargin)

    %% Create local variables

    % Required arguments
    p = varargin{1};                % position of body
    R = varargin{2};                % rotation matrix of body
    [numSamples dummy] = size(p);

    % Default values of optional arguments
    SamplePlotFreq = 1;
    Trail = ‘Off‘;
    LimitRatio = 1;
    Position = [];
    FullScreen = false;
    View = [30 20];
    AxisLength = 1;
    ShowArrowHead = ‘on‘;
    Xlabel = ‘X‘;
    Ylabel = ‘Y‘;
    Zlabel = ‘Z‘;
    Title = ‘6DOF Animation‘;
    ShowLegend = true;
    CreateAVI = false;
    AVIfileName = ‘6DOF Animation‘;
    AVIfileNameEnum = true;
    AVIfps = 30;

    for i = 3:2:nargin
        if  strcmp(varargin{i}, ‘SamplePlotFreq‘), SamplePlotFreq = varargin{i+1};
        elseif  strcmp(varargin{i}, ‘Trail‘)
            Trail = varargin{i+1};
            if(~strcmp(Trail, ‘Off‘) && ~strcmp(Trail, ‘DotsOnly‘) && ~strcmp(Trail, ‘All‘))
                error(‘Invalid argument.  Trail must be ‘‘Off‘‘, ‘‘DotsOnly‘‘ or ‘‘All‘‘.‘);
            end
        elseif  strcmp(varargin{i}, ‘LimitRatio‘), LimitRatio = varargin{i+1};
        elseif  strcmp(varargin{i}, ‘Position‘), Position = varargin{i+1};
        elseif  strcmp(varargin{i}, ‘FullScreen‘), FullScreen = varargin{i+1};
        elseif  strcmp(varargin{i}, ‘View‘), View = varargin{i+1};
        elseif  strcmp(varargin{i}, ‘AxisLength‘), AxisLength = varargin{i+1};
        elseif  strcmp(varargin{i}, ‘ShowArrowHead‘), ShowArrowHead = varargin{i+1};
        elseif  strcmp(varargin{i}, ‘Xlabel‘), Xlabel = varargin{i+1};
        elseif  strcmp(varargin{i}, ‘Ylabel‘), Ylabel = varargin{i+1};
        elseif  strcmp(varargin{i}, ‘Zlabel‘), Zlabel = varargin{i+1};
        elseif  strcmp(varargin{i}, ‘Title‘), Title = varargin{i+1};
        elseif  strcmp(varargin{i}, ‘ShowLegend‘), ShowLegend = varargin{i+1};
        elseif  strcmp(varargin{i}, ‘CreateAVI‘), CreateAVI = varargin{i+1};
        elseif  strcmp(varargin{i}, ‘AVIfileName‘), AVIfileName = varargin{i+1};
        elseif  strcmp(varargin{i}, ‘AVIfileNameEnum‘), AVIfileNameEnum = varargin{i+1};
        elseif  strcmp(varargin{i}, ‘AVIfps‘), AVIfps = varargin{i+1};
        else error(‘Invalid argument.‘);
        end
    end;

    %% Reduce data to samples to plot only

    p = p(1:SamplePlotFreq:numSamples, :);
    R = R(:, :, 1:SamplePlotFreq:numSamples) * AxisLength;
    if(numel(View) > 2)
        View = View(1:SamplePlotFreq:numSamples, :);
    end
    [numPlotSamples dummy] = size(p);

    %% Setup AVI file

    aviobj = [];                                                            	% create null object
    if(CreateAVI)
        fileName = strcat(AVIfileName, ‘.avi‘);
        if(exist(fileName, ‘file‘))
            if(AVIfileNameEnum)                                              	% if file name exists and enum enabled
                i = 0;
                while(exist(fileName, ‘file‘))                                  % find un-used file name by appending enum
                    fileName = strcat(AVIfileName, sprintf(‘%i‘, i), ‘.avi‘);
                    i = i + 1;
                end
            else                                                                % else file name exists and enum disabled
                fileName = [];                                                  % file will not be created
            end
        end
        if(isempty(fileName))
            sprintf(‘AVI file not created as file already exists.‘)
        else
            aviobj = avifile(fileName, ‘fps‘, AVIfps, ‘compression‘, ‘Cinepak‘, ‘quality‘, 100);
        end
    end

    %% Setup figure and plot

    % Create figure
    fig = figure(‘NumberTitle‘, ‘off‘, ‘Name‘, ‘6DOF Animation‘);
    if(FullScreen)
        screenSize = get(0, ‘ScreenSize‘);
        set(fig, ‘Position‘, [0 0 screenSize(3) screenSize(4)]);
    elseif(~isempty(Position))
        set(fig, ‘Position‘, Position);
    end
    set(gca, ‘drawmode‘, ‘fast‘);
    lighting phong;
    set(gcf, ‘Renderer‘, ‘zbuffer‘);
    hold on;
    axis equal;
    grid on;
    view(View(1, 1), View(1, 2));
    title(i);
    xlabel(Xlabel);
    ylabel(Ylabel);
    zlabel(Zlabel);

    % Create plot data arrays
    if(strcmp(Trail, ‘DotsOnly‘) || strcmp(Trail, ‘All‘))
        x = zeros(numPlotSamples, 1);
        y = zeros(numPlotSamples, 1);
        z = zeros(numPlotSamples, 1);
    end
    if(strcmp(Trail, ‘All‘))
        ox = zeros(numPlotSamples, 1);
        oy = zeros(numPlotSamples, 1);
        oz = zeros(numPlotSamples, 1);
        ux = zeros(numPlotSamples, 1);
        vx = zeros(numPlotSamples, 1);
        wx = zeros(numPlotSamples, 1);
        uy = zeros(numPlotSamples, 1);
        vy = zeros(numPlotSamples, 1);
        wy = zeros(numPlotSamples, 1);
        uz = zeros(numPlotSamples, 1);
        vz = zeros(numPlotSamples, 1);
        wz = zeros(numPlotSamples, 1);
    end
    x(1) = p(1,1);
    y(1) = p(1,2);
    z(1) = p(1,3);
    ox(1) = x(1);
    oy(1) = y(1);
    oz(1) = z(1);
    ux(1) = R(1,1,1:1);
    vx(1) = R(2,1,1:1);
    wx(1) = R(3,1,1:1);
    uy(1) = R(1,2,1:1);
    vy(1) = R(2,2,1:1);
    wy(1) = R(3,2,1:1);
    uz(1) = R(1,3,1:1);
    vz(1) = R(2,3,1:1);
    wz(1) = R(3,3,1:1);

    % Create graphics handles
    orgHandle = plot3(x, y, z, ‘k.‘);
    if(ShowArrowHead)
        ShowArrowHeadStr = ‘on‘;
    else
        ShowArrowHeadStr = ‘off‘;
    end
    quivXhandle = quiver3(ox, oy, oz, ux, vx, wx,  ‘r‘, ‘ShowArrowHead‘, ShowArrowHeadStr, ‘MaxHeadSize‘, 0.999999, ‘AutoScale‘, ‘off‘);
    quivYhandle = quiver3(ox, oy, oz, uy, vy, wy,  ‘g‘, ‘ShowArrowHead‘, ShowArrowHeadStr, ‘MaxHeadSize‘, 0.999999, ‘AutoScale‘, ‘off‘);
    quivZhandle = quiver3(ox, ox, oz, uz, vz, wz,  ‘b‘, ‘ShowArrowHead‘, ShowArrowHeadStr, ‘MaxHeadSize‘, 0.999999, ‘AutoScale‘, ‘off‘);

    % Create legend
    if(ShowLegend)
        legend(‘Origin‘, ‘X‘, ‘Y‘, ‘Z‘);
    end

    % Set initial limits
    Xlim = [x(1)-AxisLength x(1)+AxisLength] * LimitRatio;
    Ylim = [y(1)-AxisLength y(1)+AxisLength] * LimitRatio;
    Zlim = [z(1)-AxisLength z(1)+AxisLength] * LimitRatio;
    set(gca, ‘Xlim‘, Xlim, ‘Ylim‘, Ylim, ‘Zlim‘, Zlim);

    % Set initial view
    view(View(1, :));

    %% Plot one sample at a time

    for i = 1:numPlotSamples

        % Update graph title
        if(strcmp(Title, ‘‘))
            titleText = sprintf(‘Sample %i of %i‘, 1+((i-1)*SamplePlotFreq), numSamples);
        else
            titleText = strcat(Title, ‘ (‘, sprintf(‘Sample %i of %i‘, 1+((i-1)*SamplePlotFreq), numSamples), ‘)‘);
        end
        title(titleText);

        % Plot body x y z axes
        if(strcmp(Trail, ‘DotsOnly‘) || strcmp(Trail, ‘All‘))
            x(1:i) = p(1:i,1);
            y(1:i) = p(1:i,2);
            z(1:i) = p(1:i,3);
        else
            x = p(i,1);
            y = p(i,2);
            z = p(i,3);
        end
        if(strcmp(Trail, ‘All‘))
            ox(1:i) = p(1:i,1);
            oy(1:i) = p(1:i,2);
            oz(1:i) = p(1:i,3);
            ux(1:i) = R(1,1,1:i);
            vx(1:i) = R(2,1,1:i);
            wx(1:i) = R(3,1,1:i);
            uy(1:i) = R(1,2,1:i);
            vy(1:i) = R(2,2,1:i);
            wy(1:i) = R(3,2,1:i);
            uz(1:i) = R(1,3,1:i);
            vz(1:i) = R(2,3,1:i);
            wz(1:i) = R(3,3,1:i);
        else
            ox = p(i,1);
            oy = p(i,2);
            oz = p(i,3);
            ux = R(1,1,i);
            vx = R(2,1,i);
            wx = R(3,1,i);
            uy = R(1,2,i);
            vy = R(2,2,i);
            wy = R(3,2,i);
            uz = R(1,3,i);
            vz = R(2,3,i);
            wz = R(3,3,i);
        end
        set(orgHandle, ‘xdata‘, x, ‘ydata‘, y, ‘zdata‘, z);
        set(quivXhandle, ‘xdata‘, ox, ‘ydata‘, oy, ‘zdata‘, oz,‘udata‘, ux, ‘vdata‘, vx, ‘wdata‘, wx);
        set(quivYhandle, ‘xdata‘, ox, ‘ydata‘, oy, ‘zdata‘, oz,‘udata‘, uy, ‘vdata‘, vy, ‘wdata‘, wy);
        set(quivZhandle, ‘xdata‘, ox, ‘ydata‘, oy, ‘zdata‘, oz,‘udata‘, uz, ‘vdata‘, vz, ‘wdata‘, wz);

        % Adjust axes for snug fit and draw
        axisLimChanged = false;
        if((p(i,1) - AxisLength) < Xlim(1)), Xlim(1) = p(i,1) - LimitRatio*AxisLength; axisLimChanged = true; end
        if((p(i,2) - AxisLength) < Ylim(1)), Ylim(1) = p(i,2) - LimitRatio*AxisLength; axisLimChanged = true; end
        if((p(i,3) - AxisLength) < Zlim(1)), Zlim(1) = p(i,3) - LimitRatio*AxisLength; axisLimChanged = true; end
        if((p(i,1) + AxisLength) > Xlim(2)), Xlim(2) = p(i,1) + LimitRatio*AxisLength; axisLimChanged = true; end
        if((p(i,2) + AxisLength) > Ylim(2)), Ylim(2) = p(i,2) + LimitRatio*AxisLength; axisLimChanged = true; end
        if((p(i,3) + AxisLength) > Zlim(2)), Zlim(2) = p(i,3) + LimitRatio*AxisLength; axisLimChanged = true; end
        if(axisLimChanged), set(gca, ‘Xlim‘, Xlim, ‘Ylim‘, Ylim, ‘Zlim‘, Zlim); end
        drawnow;

        % Adjust view
        if(numel(View) > 2)
            view(View(i, :));
        end

        % Add frame to AVI object
        if(~isempty(aviobj))
            frame = getframe(fig);
            aviobj = addframe(aviobj, frame);
        end

    end

    hold off;

    % Close AVI file
    if(~isempty(aviobj))
        aviobj = close(aviobj);
    end

end
其中可以通过更改PI部分参数,重力补偿值和滤波频率,来适应自己的信号。
如果想要了解更多细节获得源程序,可以查看原官方资料网站: