<?php
$server = ‘127.0.0.1‘;
$user = ‘root‘;
$password = ‘‘;
$database = ‘yiibaidb‘;
$sql = "SELECT MC,PS FROM charts";

$conn = new mysqli($server, $user, $password, $database);

if (!$conn) {
    die(‘连接错误‘ . $conn -> connect_error);
}
$result = $conn -> query($sql);
if ($result -> num_rows > 0) {
    $arr = array();
    while ($row = $result -> fetch_assoc()) {
        $arr[]=$row;
    }
    echo json_encode($arr);
}
$conn -> close();
?>
<!DOCTYPE html>
<html lang="zh">

    <head>
        <meta charset="UTF-8" />
        <meta name="viewport" content="width=device-width, initial-scale=1.0" />
        <meta http-equiv="X-UA-Compatible" content="ie=edge" />
        <link rel="stylesheet" type="text/css" href="css/bootstrap.css" />
        <script src="http://apps.bdimg.com/libs/jquery/2.1.4/jquery.min.js" type="text/javascript" charset="utf-8"></script>
        <script src="js/echarts.min.js" type="text/javascript" charset="utf-8"></script>
        <title>Document</title>
    </head>

    <body>
        <div class="container">
            <div id="main" style="width: 1000px;height:400px;"></div>
<script type="text/javascript">
              var  myChart = echarts.init(document.getElementById(‘main‘));
              var option = {
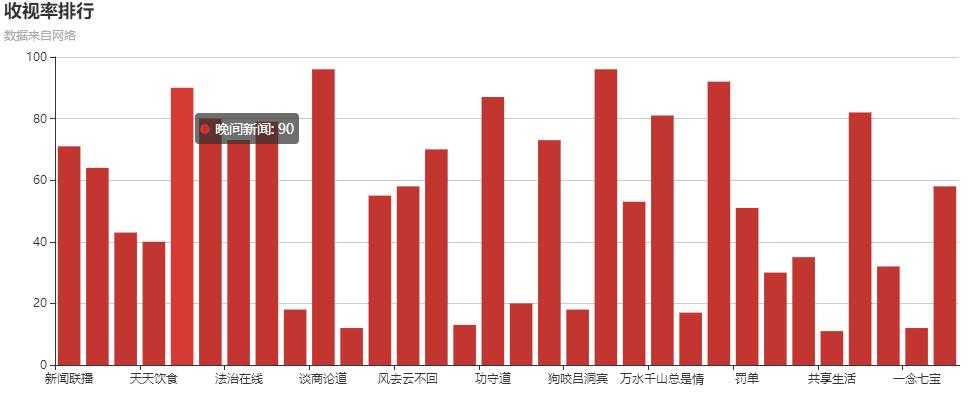
                      title: { text: ‘收视率排行‘, subtext: ‘数据来自网络‘ },
                    tooltip: {
                        show: true
                    },
                    legend: {
                       data:[‘MC‘]
                    },
                    grid: { left: ‘3%‘, right: ‘4%‘, bottom: ‘3%‘, containLabel: true },
                    xAxis : [
                        {
                            type : ‘category‘,
                            data : (function(){
                                    var arr=[];
                                        $.ajax({
                                        type : "get",
                                        async : false, //同步执行
                                        url : "query.php",
                                        data : {},
                                        dataType : "json", //返回数据形式为json
                                        success : function(result) {
                                        if (result) {
                                              console.log(result);
                                               for(var i=0;i<result.length;i++){
                                                  console.log(result[i].MC);
                                                  arr.push(result[i].MC);
                                                }
                                        }

                                    },
                                    error : function(errorMsg) {
                                        alert("sorry,请求数据失败");
                                        myChart.hideLoading();
                                    }
                                   })
                                   return arr;
                                })()
                        }
                    ],
                    yAxis : [
                        {
                            type : ‘value‘
                        }
                    ],
                    series : [
                        {
                            "MC":"PS",
                            "type":"bar",
                            "data":(function(){
                                        var arr=[];
                                        $.ajax({
                                        type : "get",
                                        async : false, //同步执行
                                        url : "query.php",
                                        data : {},
                                        dataType : "json", //返回数据形式为json
                                        success : function(result) {
                                        if (result) {
                                               for(var i=0;i<result.length;i++){
                                                  console.log(result[i].PS);
                                                  arr.push(result[i].PS);
                                                }
                                        }
                                    },
                                    error : function(errorMsg) {
                                        alert("sorry,请求数据失败");
                                        myChart.hideLoading();
                                    }
                                   })
                                  return arr;
                            })()

                        }
                    ]
                };
                // 为echarts对象加载数据
                myChart.setOption(option);
            // }
    </script>
    </body>

</html>
SET FOREIGN_KEY_CHECKS=0;

DROP TABLE IF EXISTS `charts`;
CREATE TABLE `charts` (
  `id` int(11) NOT NULL AUTO_INCREMENT,
  `MC` varchar(255) DEFAULT NULL,
  `PS` int(255) DEFAULT NULL,
  PRIMARY KEY (`id`)
) ENGINE=MyISAM AUTO_INCREMENT=33 DEFAULT CHARSET=utf8;

INSERT INTO `charts` VALUES (‘1‘, ‘新闻联播‘, ‘71‘);
INSERT INTO `charts` VALUES (‘2‘, ‘朝闻天下‘, ‘64‘);
INSERT INTO `charts` VALUES (‘3‘, ‘焦点访谈‘, ‘43‘);
INSERT INTO `charts` VALUES (‘4‘, ‘天天饮食‘, ‘40‘);
INSERT INTO `charts` VALUES (‘5‘, ‘晚间新闻‘, ‘90‘);
INSERT INTO `charts` VALUES (‘6‘, ‘正大综艺‘, ‘80‘);
INSERT INTO `charts` VALUES (‘7‘, ‘法治在线‘, ‘73‘);
INSERT INTO `charts` VALUES (‘8‘, ‘今日说法‘, ‘79‘);
INSERT INTO `charts` VALUES (‘9‘, ‘央视2套‘, ‘18‘);
INSERT INTO `charts` VALUES (‘10‘, ‘谈商论道‘, ‘96‘);
INSERT INTO `charts` VALUES (‘11‘, ‘早间精编‘, ‘12‘);
INSERT INTO `charts` VALUES (‘12‘, ‘嫁狗‘, ‘55‘);
INSERT INTO `charts` VALUES (‘13‘, ‘风去云不回‘, ‘58‘);
INSERT INTO `charts` VALUES (‘14‘, ‘羞羞的小狗‘, ‘70‘);
INSERT INTO `charts` VALUES (‘15‘, ‘我们变他们了‘, ‘13‘);
INSERT INTO `charts` VALUES (‘16‘, ‘功守道‘, ‘87‘);
INSERT INTO `charts` VALUES (‘17‘, ‘虎父无犬子‘, ‘20‘);
INSERT INTO `charts` VALUES (‘18‘, ‘因为爱情‘, ‘73‘);
INSERT INTO `charts` VALUES (‘19‘, ‘狗咬吕洞宾‘, ‘18‘);
INSERT INTO `charts` VALUES (‘20‘, ‘兔子爱萝卜‘, ‘96‘);
INSERT INTO `charts` VALUES (‘21‘, ‘最后一张车票‘, ‘53‘);
INSERT INTO `charts` VALUES (‘22‘, ‘万水千山总是情‘, ‘81‘);
INSERT INTO `charts` VALUES (‘23‘, ‘一带一路‘, ‘17‘);
INSERT INTO `charts` VALUES (‘24‘, ‘阿里巴巴‘, ‘92‘);
INSERT INTO `charts` VALUES (‘25‘, ‘罚单‘, ‘51‘);
INSERT INTO `charts` VALUES (‘26‘, ‘水城烙锅‘, ‘30‘);
INSERT INTO `charts` VALUES (‘27‘, ‘内蒙‘, ‘35‘);
INSERT INTO `charts` VALUES (‘28‘, ‘共享生活‘, ‘11‘);
INSERT INTO `charts` VALUES (‘29‘, ‘中国欢迎你‘, ‘82‘);
INSERT INTO `charts` VALUES (‘30‘, ‘集帮‘, ‘32‘);
INSERT INTO `charts` VALUES (‘31‘, ‘一念七宝‘, ‘12‘);
INSERT INTO `charts` VALUES (‘32‘, ‘都选C‘, ‘58‘);

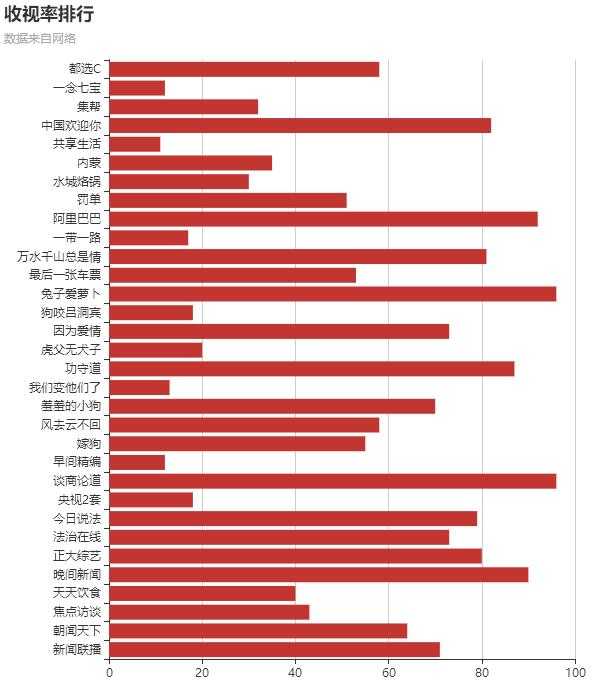
yAxis xAxis交换后,更改画布大小

